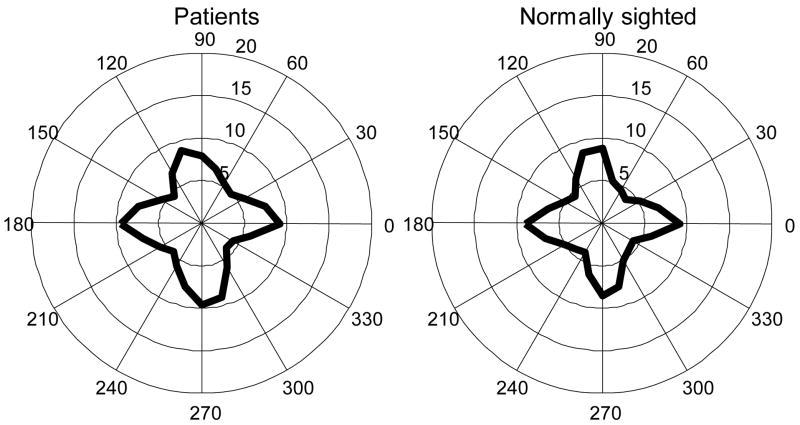
Figure 4.
Saccade direction polar histograms (average across subjects) in a real-world walking experiment. Unit along radii: saccade/minute. Bin size: 15°. Left: saccade direction of five patients with tunnel vision. Right: saccade direction of three normal controls. No obvious difference is noted between the two groups.

