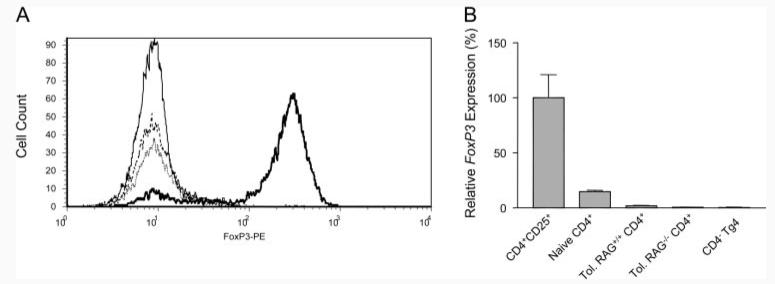
FIGURE 7.
Expression of FoxP3 in naive and peptide-treated, tolerant Tg4 cellsTg4 cells from naive and tolerant mice were subjected to surface staining for CD4 and CD25 and intracellular staining for FoxP3. A, Levels of FoxP3 expression among CD4+CD25+ cells freshly isolated from a naive mouse or from tolerant mice following culture with Ag and IL-2 for 5 days. Solid line, isotype control; bold line, gated CD4+CD25+ cells from a naive mouse; dotted line, gated CD4+CD25+ cells from a RAG+/+ peptide-treated, tolerant mouse, and hatched line, gated CD4+CD25+ cells from a RAG−/− peptide-treated, tolerant mouse. B, Relative levels of FoxP3 RNA expression, normalized to β2-microglobulin, in the cell fractions depicted in A. The results represent the mean of two to three separate analyses and the experiments were repeated twice with similar results.

