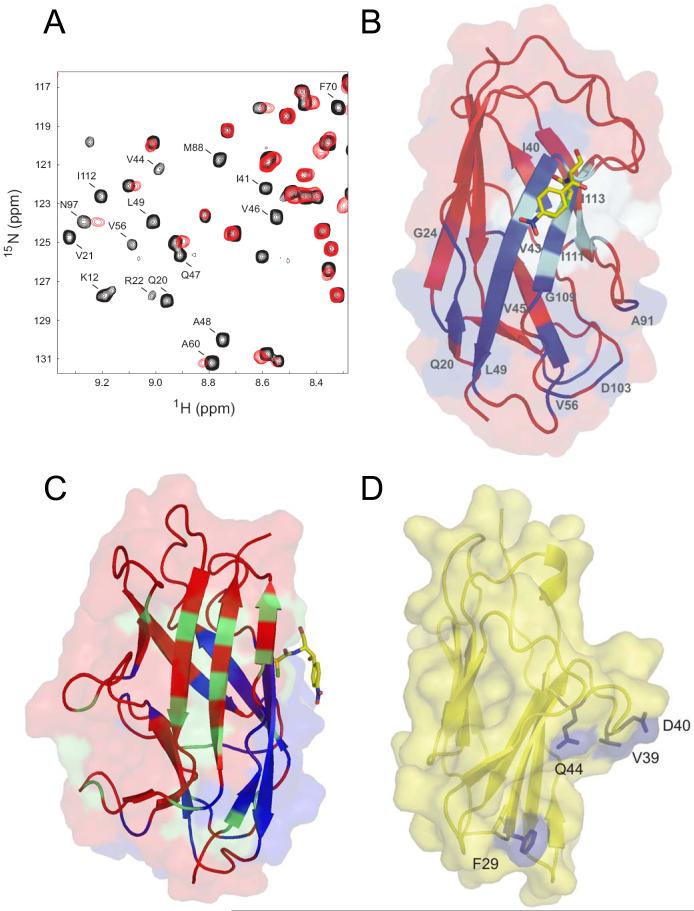
Fig. 5. Chemical shift mapping of the N-CEA/AfaE-III interaction.
A) Region of the 2D 1H-15N HSQC spectrum of AfaEIII-dsc in the absence (black) and presence (red) of excess N-CEA. Peaks undergoing significant shift changes and/or broadening are labelled. B) Combined surface and ribbon representation of AfaE-III-dsc with perturbed amide resonances upon N-CEA addition colored in dark blue, Cm shown in stick representation and position of mutants with altered CEA binding in cyan. C) Surface and ribbon representation of AfaE-III-dsc with NMR-derived binding sites for CEA and DAF colored blue and green respectively with Cm as a yellow stick representation [31,33]. Orientation is chosen is approximately 90y° rotation relative to Figure 5,B D) Surface and ribbon representation (yellow) of a homology model of human N-CEA derived from the crystal structure of murine N-CEACAM1 [34]. Solvent exposed mutant resides that display altered DraE binding are shown in blue.

