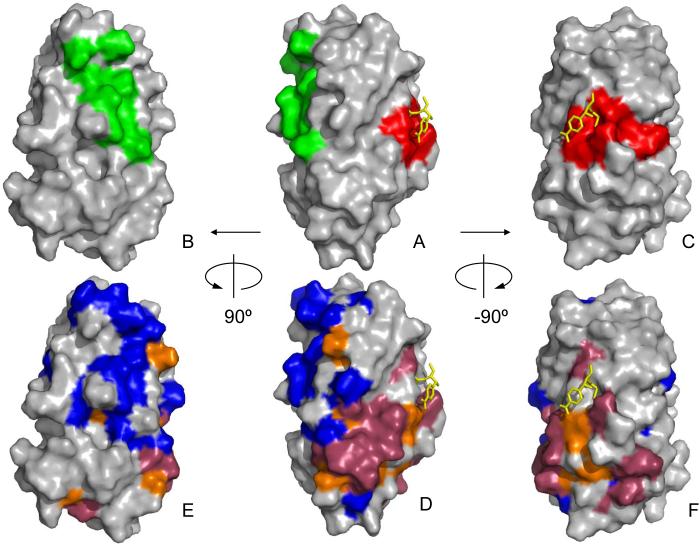
Fig. 6. DraE/AfaE-III adhesin binding-associated surfaces.
Surface representation of AfaE-III-dsc with Cm as a yellow stick representation [31,33]. Orientation of A-C the same as D-F, respectively. A-C) DAF [28] and CEA binding sites derived from DraE mutagenesis are shown in green and red, respectively. D-F) DAF-specific interactions derived from chemical shift mapping analysis of AfaE-III-dsc shown in blue [31]. CEA-specific interactions derived from chemical shift analysis of AfaE-III-dsc is shown in dark red. Chemical shift mapping of interactions common to DAF and CEA shown in orange [31].

