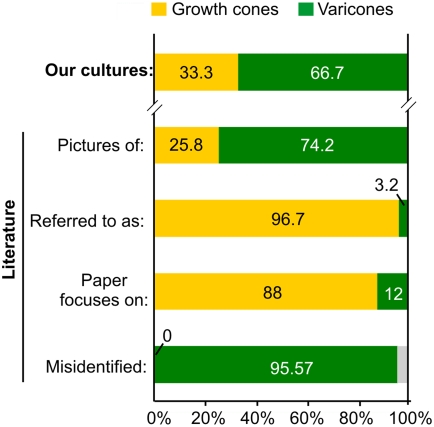
Figure 6. Misidentification of varicones in the literature.
Histogram showing the frequencies of growth cones and varicones in our cultures (top bar) and in the images published in the literature (second bar), including the notation used in those articles (third), the central topic of the article (fourth) and the frequency of errors in the identification of growth cones (always correctly identified) or varicones (usually regarded as a growth cone) in the literature (lower bar).

