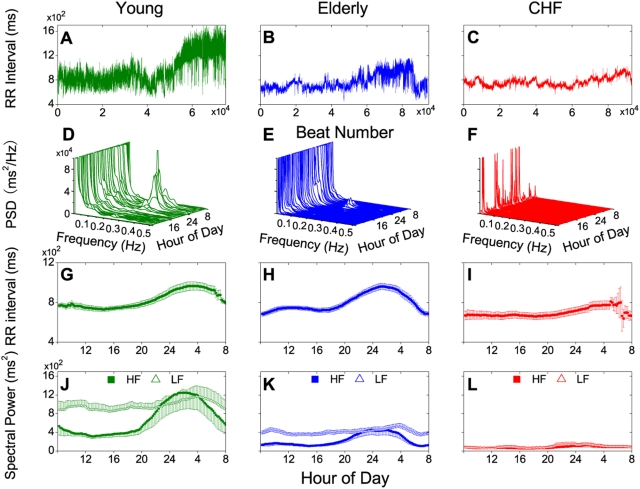
Figure 1. Circadian heart rate variability and mean beat-to-beat (RR) interval in young (green) or elderly subjects (blue) and patients with congestive heart failure (red) as revealed by Holter recordings (sampling rate was 128 Hz for the young group, 250 Hz for the CHF group and 1 kHz for the elderly group).
A–C: 24-hr RR interval tachogram in one representative subject from each group. D–F: Corresponding spectral arrays with power spectral density vs. frequency in Hz evaluated by standard autoregression methods [2] at 30-min intervals. G–I: Mean RR intervals (±SE) vs. time for each group. J–L: Corresponding HF (0.15–0.4 Hz) and LF (0.04–0.15 Hz) power. Data points for G–L were evaluated at 12-min intervals and averaged over a moving 3-hr time window for each subject before group averaging.

