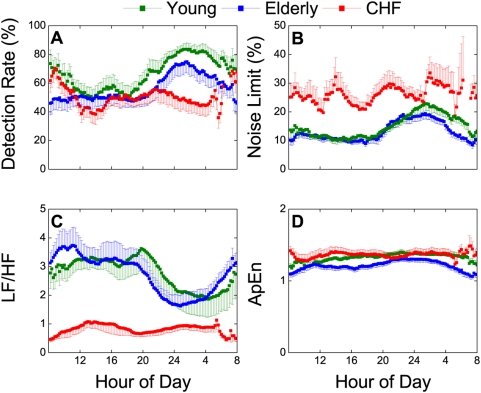
Figure 3. Chaotic vs. spectral and stochastic measures of heart rate variability in young, elderly and CHF groups.
A. Detection rate (DR). B. Noise limit (NL). C. LF/HF power ratio. D. Approximate entropy (ApEn). The average DR and NL and LF/HF values were not significantly different between the young and elderly groups (repeated measures ANOVA, P>0.1) but were markedly different in the CHF group. The elderly group had significantly different ApEn values than the young group (P = 0.02) and CHF group (P = 0.04) but the difference between the young and CHF groups were marginal (P = 0.61).

