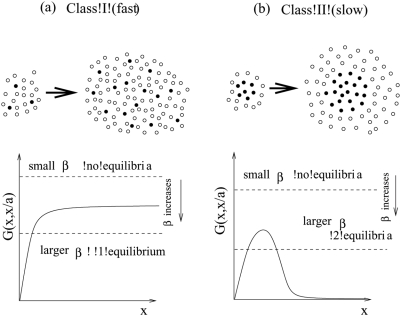
Figure 1. Two classes of virus growth captured by the mathematical models.
(a) According to class I or fast virus growth, virus growth is exponential as long as the number of uninfected cells is significantly larger than the number of infected cells. This can correspond to a high degree of mixing between infected and uninfected cells. As the virus population grows, the number of cells that contribute to virus spread remains constant because most infected cells will have an uninfected cell in their vicinity. (b) According to class II or slow virus growth, virus growth slows down and saturates as the virus population increase in size, even if the number of uninfected cells is relatively large. This can correspond to spatial clustering of the infected cells. Only infected cells at the surface have uninfected cells in their neighborhood and can thus contribute to virus transmission. As the number of infected cells rises, the number of “active” cells that can contribute to virus transmission declines.

