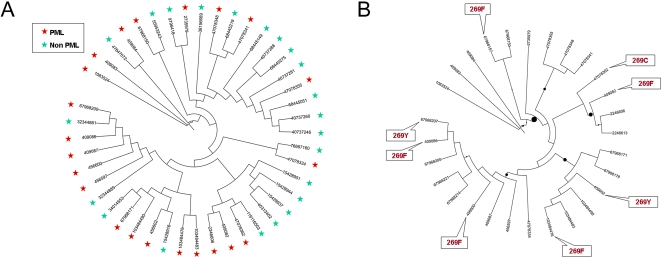
Figure 1. Phylogenetic distribution of PML associated viruses.
(A) Broad phylogenetic distribution of PML causing JC viruses. Tree branches (labeled by GI numbers) corresponding to PML causing viruses are marked by red stars, viruses isolated from healthy subjects are marked by green stars. The tree is constructed based on DNA sequences of VP1 gene using maximum likelihood method. Only one sequence per patient was included. (B) Phylogenetic distribution of mutations in the codon 269. The tree represents VP1 genes (labeled by GI numbers) of viruses isolated from PML patients. Mutations in Ser269 codons are indicated by text inserts. Circles on branches reflect aLRT support. Position 269 was masked prior to constructing the tree to avoid attraction of branches with mutations of this codon.

