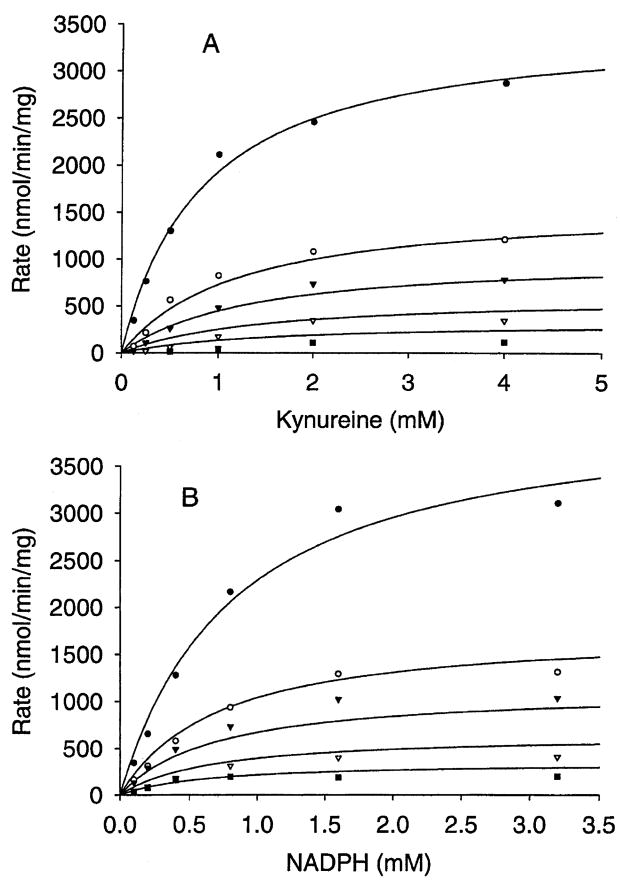
Figure 8.
Inhibition of KMO by Cl−1. The Michaelis–Menten curves of different concentrations of Cl−1: zero (closed circles), 25 mM (open circles), 50 mM (closed triangles), 100 mM (open triangles) and 200 mM (closed squares). (A) Activity was assayed at a fixed concentration of NADPH (3.2 mM) and different concentrations of kynurenine (0.125, 0.25, 0.5, 1, 2, 4 mM); (B) activity was assayed at a fixed concentration of kynurenine (4 mM) and different concentrations of NADPH (0.1, 0.2, 0.4, 0.8, 1.6, 3.2 mM).

