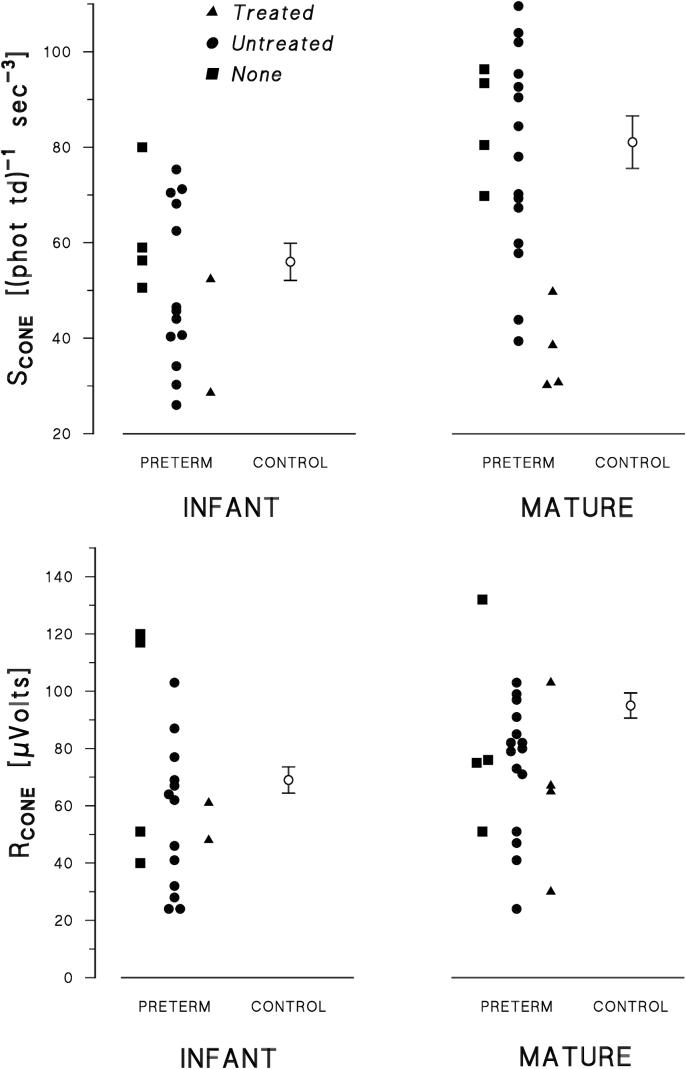
Figure 2.
Values of SCONE (upper panels) and RCONE (lower panels) in former preterm subjects (N=42), grouped by age at test. Different symbols indicate each ROP category: treated, untreated, none. In each panel, the mean (±SEM) for the term born controls12 is also shown.

