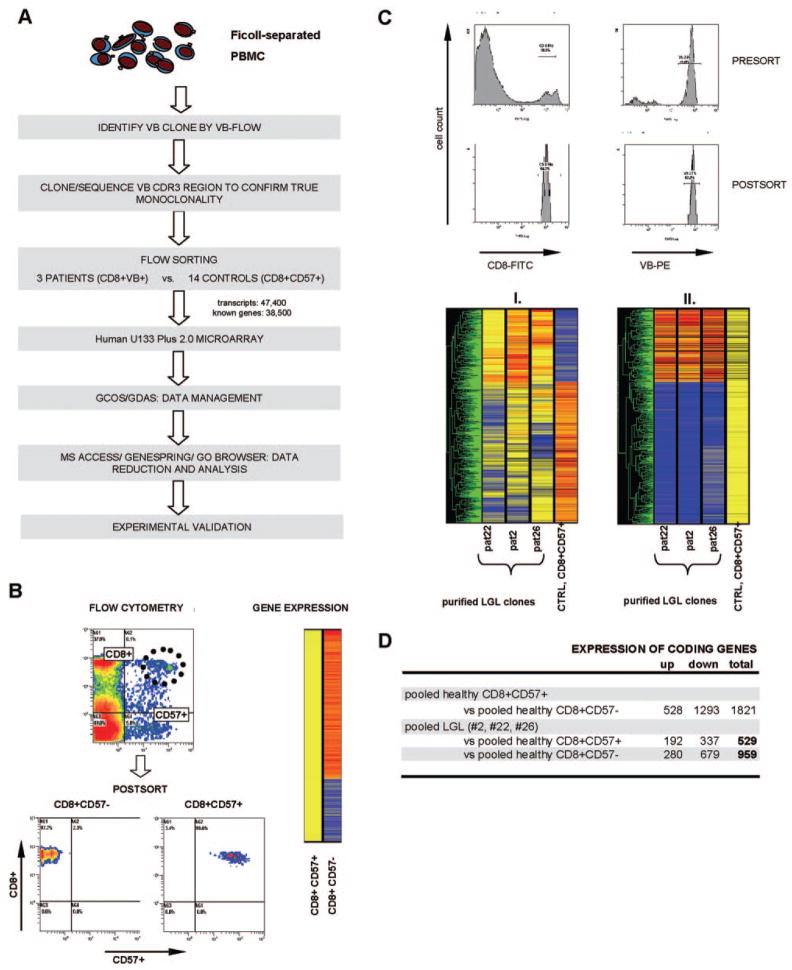
Fig. 1.
Detection of pathologically altered gene expression in LGL patients. (A) Rational experimental approach for the analysis of differential gene expression in purified LGL clones and healthy control effector cells. Initially, VB family expansions were identified by VB flow cytometry, and monoclonal TCR CDR3 regions were confirmed by cloning and sequencing. Control CD8+CD57+ cells and patients VB+ LGL clones and/or CD8+ cells were sorted using standard flow cytometry. Purified LGL clones and control CD8+CD57+ populations were run on a microarray, and the data were reduced and analyzed using GCOS/GeneChip DNA Analysis software (GDAS), MS Access, Genespring, and Go Browser. Finally, experimental validation was performed on the validation cohort consisting of additional LGL patients and healthy controls. (B) Flow cytometric sorting and Genespring hierarchical clustering of the gene expression profile of healthy effector cells expressing CD57+. Purity of cells was analyzed after sorting. (C) The upper panel shows exemplary flow cytometric sorting based on the expression of a monoclonal VB chain and postsort purity analysis on one selected patient. The lower panel illustrates Genespring analysis between LGL patients (pat) and controls (CTRL), which was graphically represented in hierarchical clustering in two ways: (I.) Data were normalized to the expression values of the control CD8+CD57+ population (per-sample normalization); (II.) to the median value of the six combined probe sets for CD8 antigen (per-gene normalization). (D) Differential expression of healthy effector CD8+CD57+ versus CD8+CD57− and of purified VB clones versus healthy CD8+CD57+/CD8+CD57− is shown.

