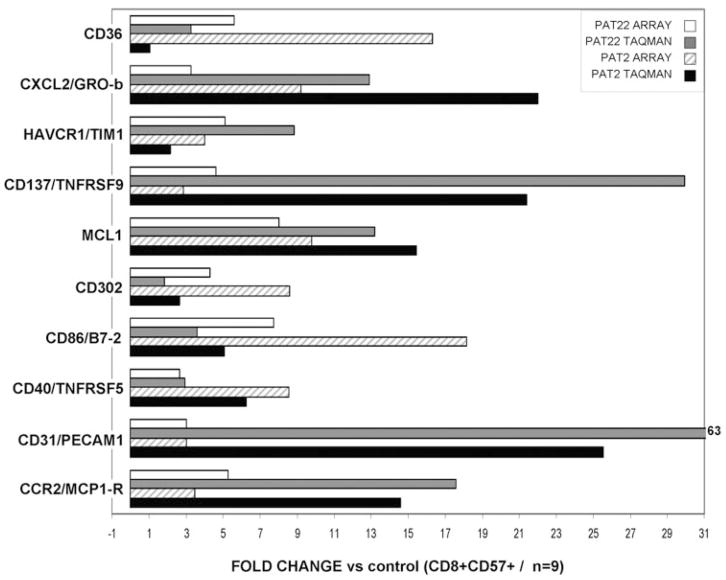
Fig. 2.
Validation of microarray data. Relative expression of 10 representative genes was determined in two patients (previously studied by microarray) using Taqman PCR. Mean difference of comparative threshold (dCT; d of the threshold cycle) values of nine control CD8+CD57+ samples was used as a calibrator to calculate relative expression of LGL patients. GRO-b, Growth-related oncogene-β; HAVCR1/TIM1, Hepatitis A virus cellular receptor 1/T cell Ig and mucin domain-containing protein.

