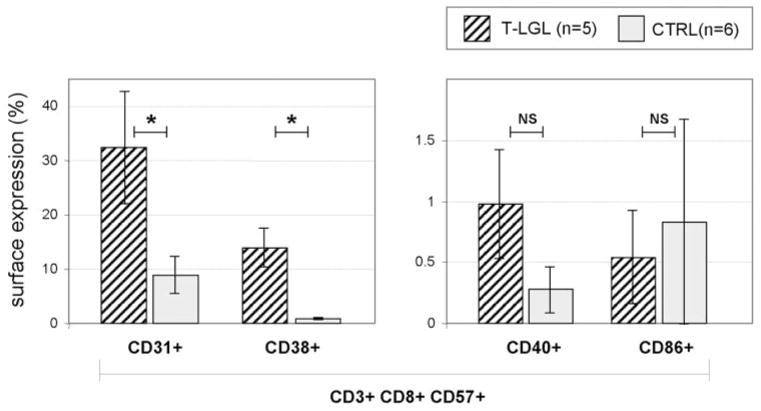
Fig. 5.
Surface expression of selected antigens in LGL patients and healthy controls. Hatched bars illustrate average expression values of selected four surface markers (CD31, CD38, CD40, and CD86) on the CD3+CD8+CD57+ cell population in five LGL patients, and shaded bars represent the values obtained from six healthy controls. Error bars represent SD. NS, P > 0.05. *, P < 0.05, by Student’s unpaired t-test.

