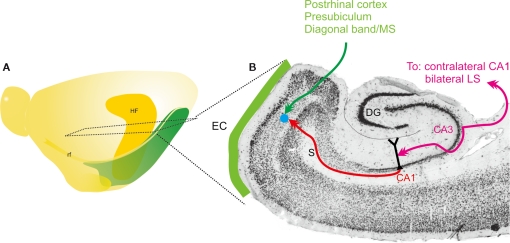
Figure 1.
Schematic representation of main connectivity of the CA3-to-CA1-to-entorhinal connections. (A) Schematic drawing of the left hemisphere of the rat brain indicating the position and extend of the hippocampal formation (HF) and entorhinal cortex. Also indicated is the level of the horizontal section, represented in (B). (B) Horizontal section of the rat hemisphere illustrating the entorhinal cortex (EC), some of its main inputs from postrhinal cortex, presubiculum and diagonal band/medial septum (MS) in green. In purple, the bilateral connectivity of CA3 to CA1 and the lateral septum (LS) is indicated. Red indicates the ipsilateral projection from CA1 to entorhinal cortex. The blue dot schematically illustrates the deposit of the RV-vector.

