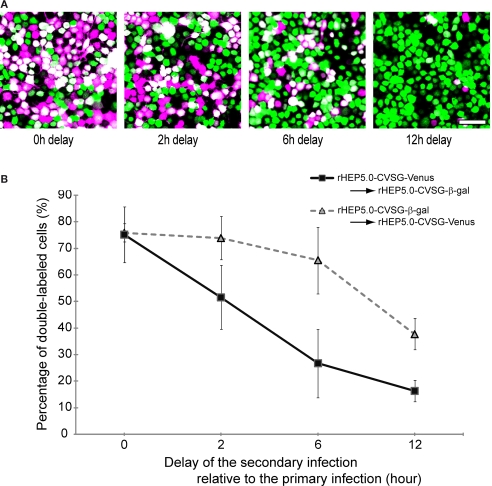
Figure 3.
Double labeling of cultured cells following infection of two viruses at different time intervals. (A) Fluorescence photomicrographs of NA cells labeled by rHEP5.0-CVSG-Venus (green) and rHEP5.0-CVSG-β-gal (magenta). Cultured cells were primary infected with rHEP5.0-CVSG-Venus, and after a certain time delay (0 h, 2 h, 6 h, 12 h), further infected with rHEP5.0-CVSG-β-gal. Double-labeled neurons are shown in white. (B) The percentage (mean + SD) of double-labeled neurons among the cells labeled by the firstly applied RV-vector was determined for each set of conditions. NA cells were infected with rHEP5.0-CVSG-Venus prior to rHEP5.0-CVSG-β-gal (squares), or infected with rHEP5.0-CVSG-β-gal prior to rHEP5.0-CVSG-Venus (triangles). Note that the rate of double-labeled neurons decreases as the time delay gets longer. Scale bar = 50 μm in (A).

