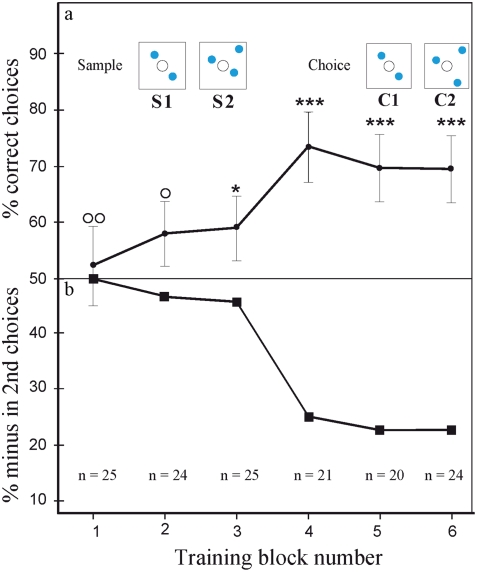
Figure 2.
(a) Learning curve for bees trained on a basic delayed match-to-sample (DMTS) task. Each ‘block’ represents two twenty-minute sessions of training (one for each sample S1 and S2). Bees were considered to be trained in this task when their performance reached a stable plateau (approximately 70% correct choices). n denotes number of bees per condition. Error bars show standard error. *** denotes statistically significant difference at p<0.001, * denotes p<0.05. (b) The incorrect second choices of bees in each of the training blocks, following a positive first choice.

