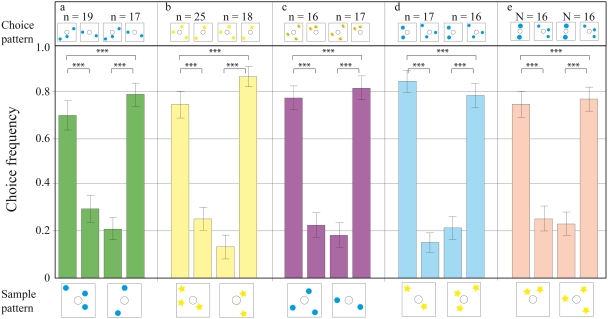
Figure 3. Results of transfer tests with various pattern configurations.
The pattern below each pair of bars is the sample and that above each bar is the choice pattern; the y-axis gives the choice frequency. The data represent the pooled first choices (from each foraging trip) of individual bees. (a) The configuration of dots on the sample and choice patterns is randomised. (b) The blue dot patterns in (a) are replaced with yellow stars, to see if bees can transfer their matching ability to different, unknown stimuli. (c) The sample and choice patterns are composed of different elements. (d) The choice patterns are modified so that the total area of the elements is equal. (e) The choice elements are modified so that the total edge length of the elements is equal. n = number of bees per condition. Error bars show standard error. *** denotes statistically significant difference at p<0.001, ** denotes p<0.01, * denotes p<0.05 and ○ denotes p>0.05.

