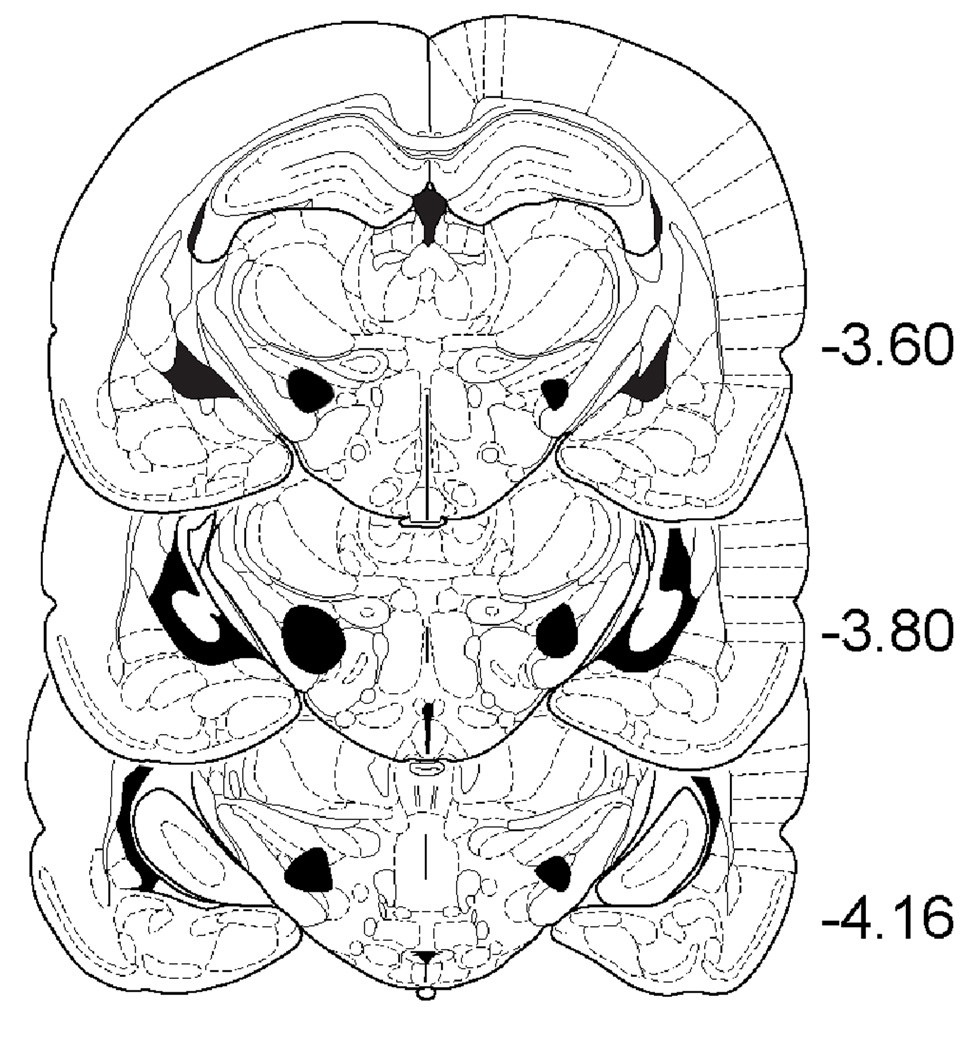
Fig. 4.
Schematic representations showing the minimal (left side) and maximal (right side) extent of STN lesions. Schematic representations are adapted from the rat brain atlas of Paxinos and Watson (1998), with numbers on the right indicating distance (mm) from Bregma.

