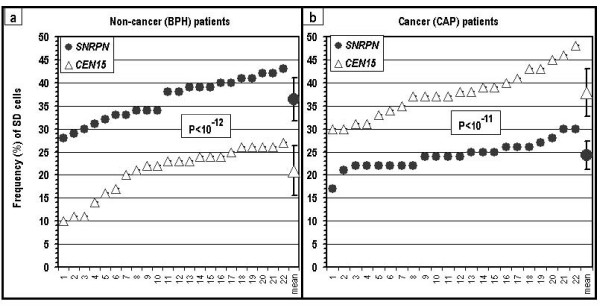
Figure 2.
SD values for SNRPN and CEN15 in cells of two groups of urology patients: (a) patients free of cancer (BPH); and (b) cancer patients (CAP). The values in each frame for each locus are presented in increasing order. P – the level of significance of the differences between the SNRPN and the CEN15 loci within a group of patients.

