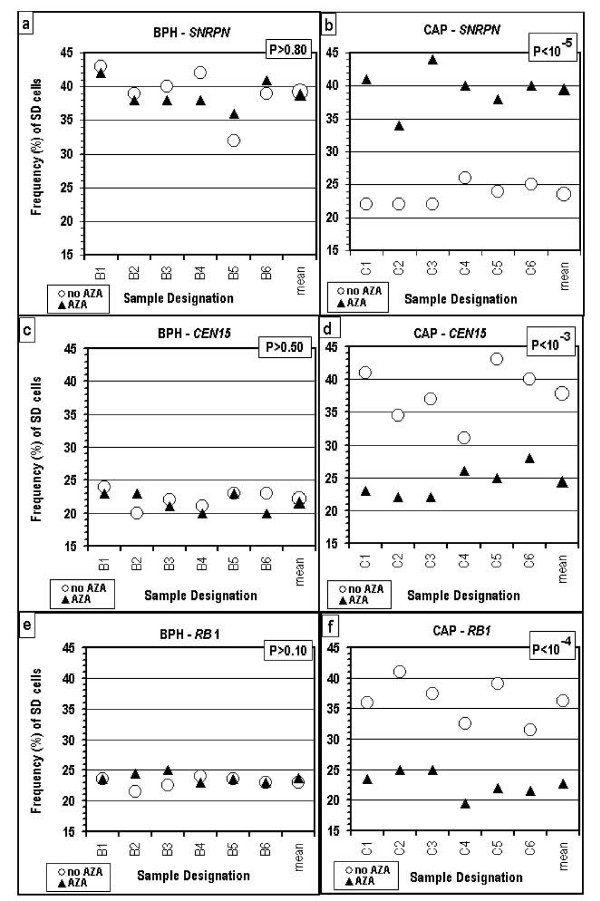
Figure 3.
SD values for the SNRPN, CEN15 and RB1 loci, in the absence (○) and in the presence (▲) of AZA. (a), (c) and (e) values of patients free of cancer (BPH cases); (b), (d) and (f) values of urology cancer patients (CAP cases). P – the level of significance of the differences between corresponding values obtained in the presence and absence of AZA.

