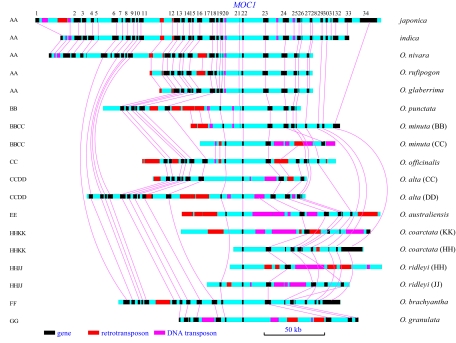
Fig. 1.
Genomic alignment of the MOC1 region in 18 Oryza genomes or subgenomes. The species are ordered by genome type. Horizontal light blue bars represent genomic sequence in the MOC1 region. Gene models are shown in black rectangles. Transposons (at least 1 kb) are shown in red and pink for retrotransposons and DNA transposons, respectively. Lines/curves connect orthologous genes with each other and orthologous transposons with each other.

