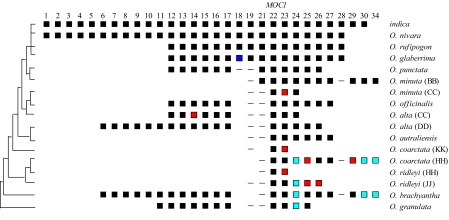
Fig. 2.
Gene evolution in the MOC1 region in Oryza. Numbers on the top represent genes in japonica. Each row represents an Oryza genome or subgenome. Black rectangles indicate that the genome has an ortholog with identical exon/intron structure to japonica. Blue rectangles indicate that the genome has an ortholog with different exon/intron structure from the japonica gene. Red rectangles indicate pseudogenes. Light blue rectangles indicate genes with ambiguous structure or functionality. Short lines indicate the presence of partial homology to candidate genes (18, 19, 21, and 28) that are predicted to have been created de novo in the AA lineage leading to japonica. Candidate genes 20, 31, 32, and 33 are not shown because their predicted exon/intron structures have not been confirmed experimentally in japonica rice. The Oryza phylogenetic tree is shown on the left.

