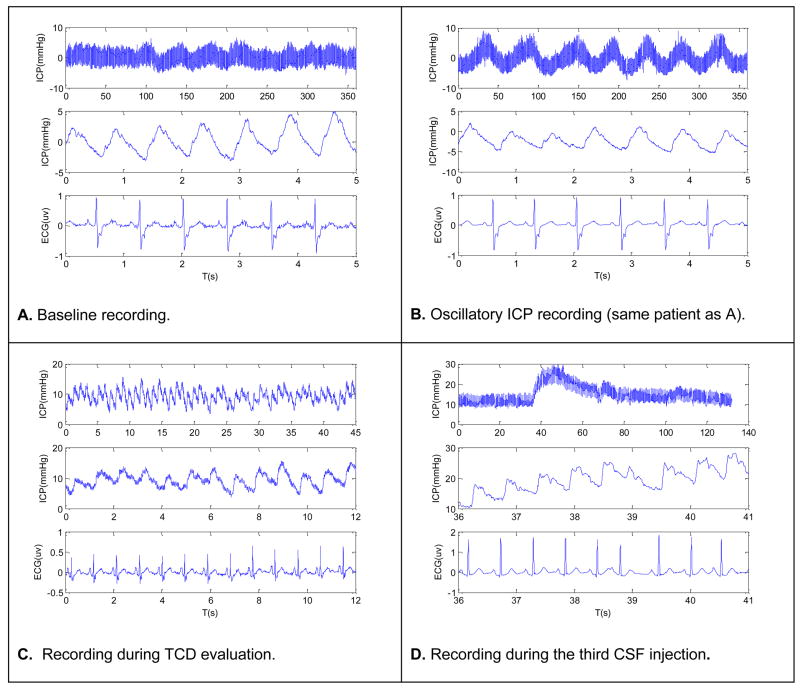
Fig.3.
Four representative plots of ICP and ECG. Each plot corresponds to one of the four recording conditions that include baseline recording, oscillatory ICP state, recording during TCD evaluation, and recording during bolus CSF injection tests. The top trace of each plot shows a long ICP segment with the bottom two traces showing shorter segments of ECG and ICP, respectively.

