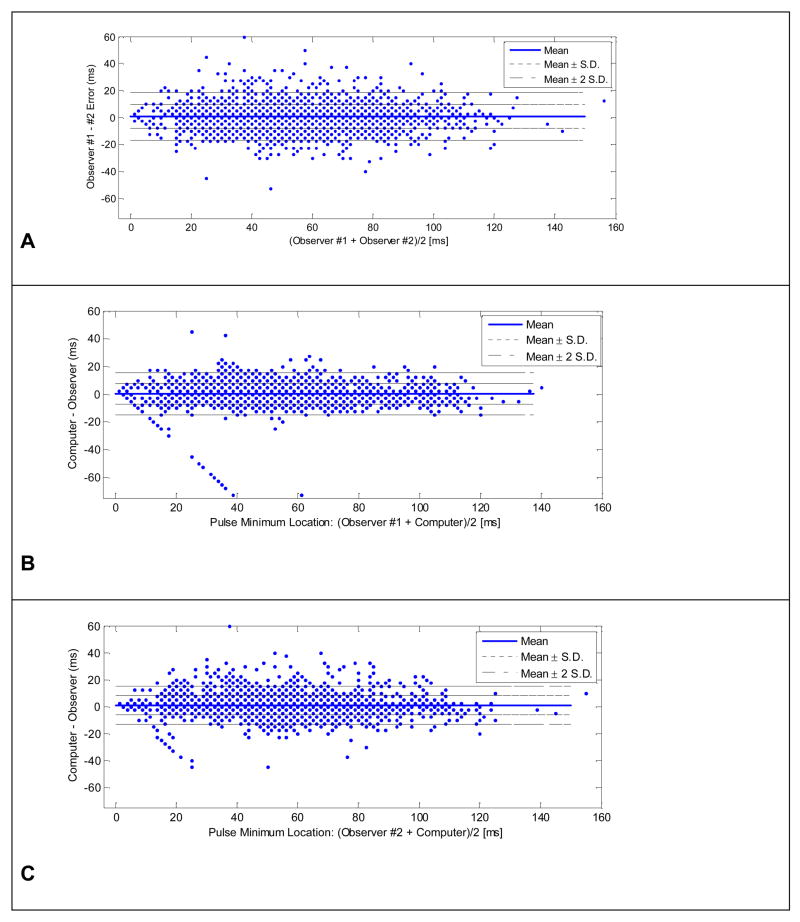
Fig.6.
Bland-Altman plots for assessing the agreement of locations of ICP pulse minimum marked by two observers and the computer algorithm. Panel A shows the Bland-Altman plot comparing two observers and Panels B and C display those comparing the algorithm and the first and the second observer, respectively.

