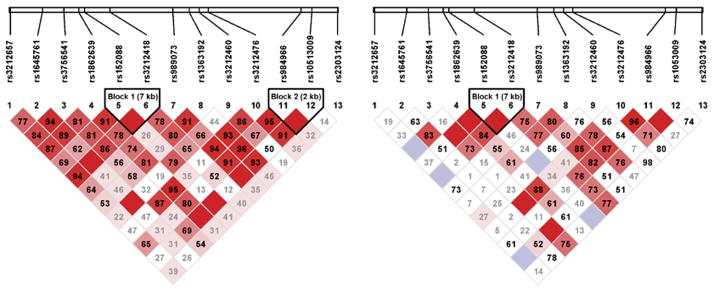
Figure 1.
Linkage equilibrium blocks in the white (left) and nonwhite (right) patient groups. Numbers within the diamonds are D′ values for the respective SNP pairs. Solid red diamonds represent absolute LD (D′ =1), blue diamonds represent strong LD with low level of significance. Numbers in gray within white diamonds represent a high probability or evidence of historical recombination.

