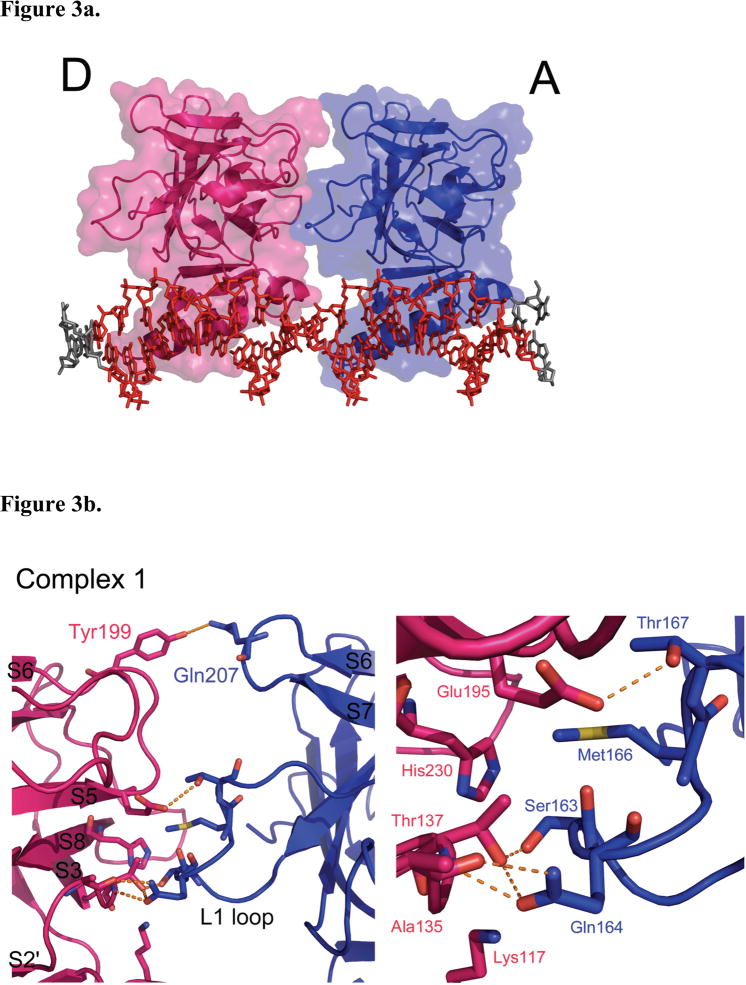
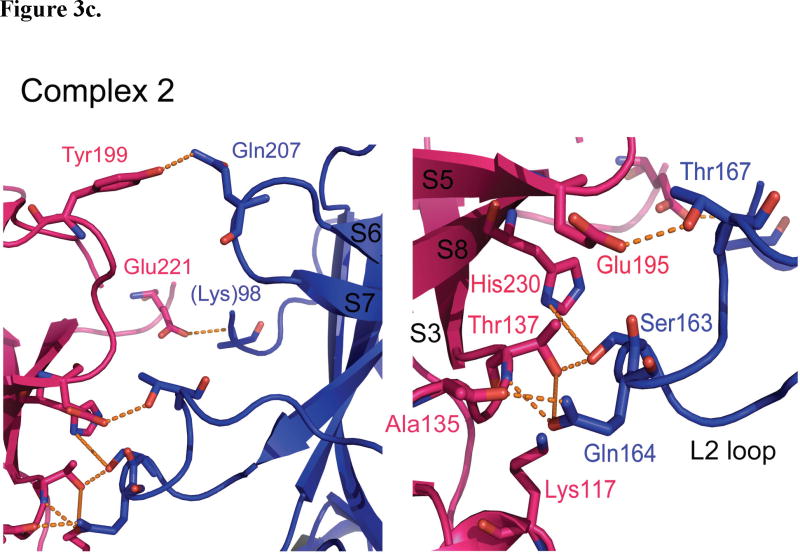
Figure 3.
p53DBD dimer-dimer formation. (a) View of subunits A (blue) and D (magenta) in surface representation for structure 1 (DeLano, 2002). Subunits B and C have been removed for clarity. (b) Overall view (left) and close up view (right) of the dimer-dimer interaction between subunits A and D for Structure 1. (c) Overall view (left) and close up view (right) of the dimer-dimer interaction between subunits A and D for structure 2. Hydrogen bonds are depicted as orange dashed lines. The same interactions are seen between subunits B and C for both structures.


