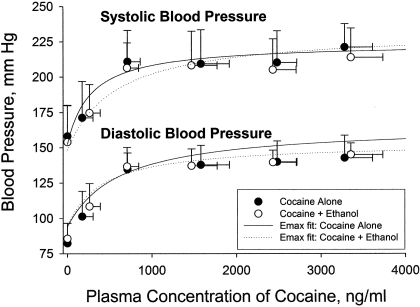
Fig. 2.
Concentration-effect plots of blood pressure. Each data point represents the mean concentration-effect with the vertical error bar indicating the S.D. of the measured effect and the horizontal error bar representing the S.D. in the cocaine plasma concentration. The solid and broken lines are derived from the simple Emax model equation using the mean (n = 6) values of E0, EC50, and Emax for cocaine alone and cocaine plus ethanol. The virtually superimposable Emax fits indicate that ethanol does not alter the concentration-effect relationship of cocaine.

