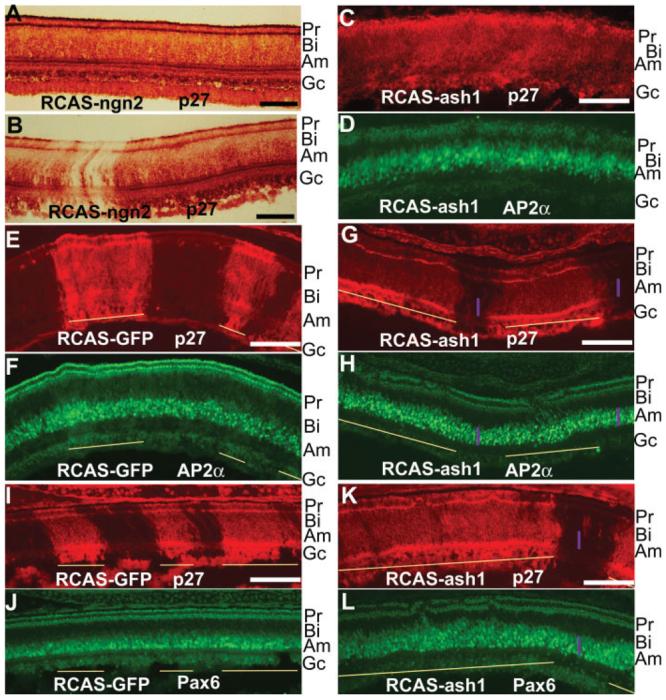
Figure 3.

Expansion of amacrine territories in retinas infected with RCAS-ash1. A, B: Immuno-staining for viral protein p27 in E12 retinas thoroughly (A) or partially (B) infected by RCAS-ngn2. C, D: Double-labeling of an E8 retina thoroughly infected with RCAS-ash1 for viral protein p27 (C) and for AP2α (D). E, F: Double-labeling of an E10 control retina partially infected with RCAS-GFP for p27 to identify viral infection (E) and for AP2α to identify amacrine cells (F). G, H: Double-labeling of an E10 retina partially infected with RCAS-ash1 for p27 (G) and for AP2α (H). I, J: Double-labeling of an E10 control retina partially infected with RCAS-GFP for p27 (I) and for Pax6 to identify amacrine cells (J). K, L: Double-labeling of an E10 retina partially infected with RCAS-ash1 for p27 (K) and for Pax6 (L). Purple bars mark the domain thickness of AP2α+ cells (G, H) or Pax6+ cells (K, L). Yellow lines mark virally infected regions. The anatomical location of each major cell type is marked on the right. Pr, photoreceptors; Bi, bipolar cells; Am, amacrine cells; Gc, ganglion cells. Scale bars: 100 μm.
