
Figure 5.
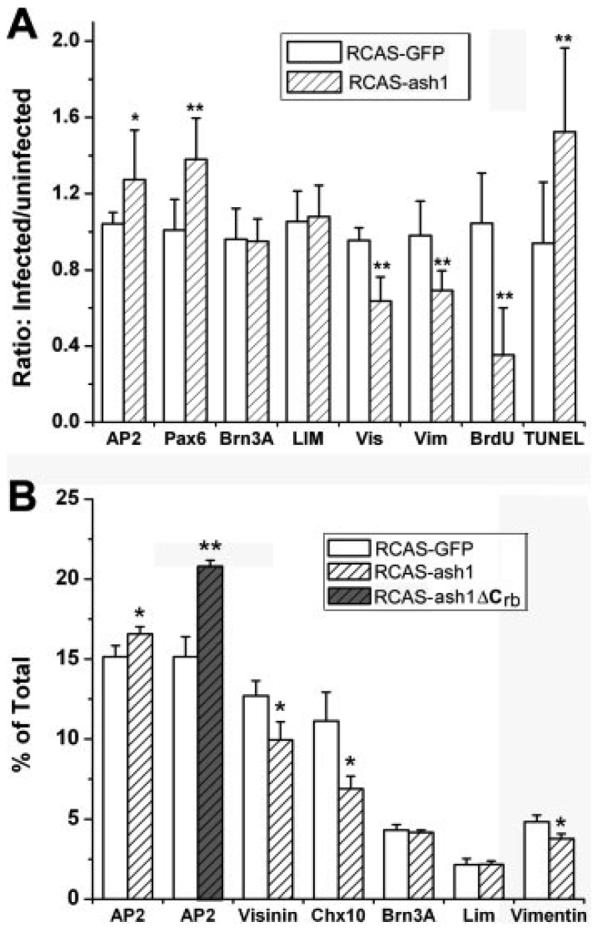
Quantitative analyses of the effect of ash1 overexpression on various retinal cell populations. A: A plot of the ratios of immuno-positive cells in infected regions over adjacent, uninfected regions in retinal sections. B: The percentage of cells positive for each marker. Data were obtained using dissociated E9 retinal cells (or E8 for RCAS-ash1ΔCrb) seeded into culture dishes. AP2, AP2α for amacrine cells; Pax6 for amacrine cells; Brn3A for ganglion cells; LIM for horizontal cells; Vis, visinin for photoreceptor cells; Vim, vimentin for Müller glia; chx10 mRNA for bipolar cells; BrdU for proliferating cells; TUNEL for apoptotic cells. Shown are means ± SDs. “*” indicates statistically significant at p < 0.05 level, and “**” at p < 0.01 level.