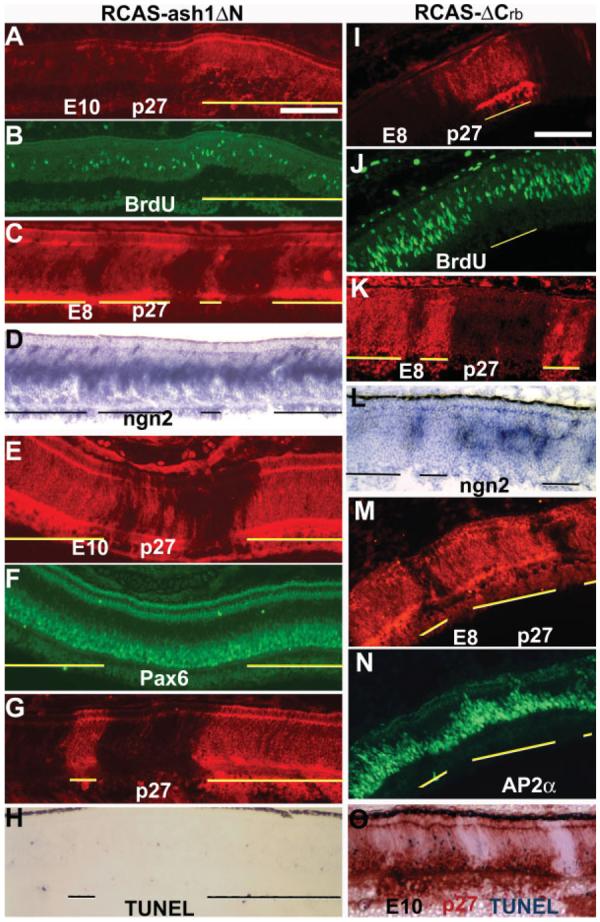
Figure 9.

Differential effects on retinal cell populations between RCAS-ash1ΔN and RCAS-ash1ΔCrb. A–H: Double-labeling of E8 (A–D) or E10 (E–H) retinas infected with RCAS-ash1ΔN for viral protein p27 to identify infected regions (A, C, E, G) and for BrdU (B), ngn2 expression (D), Pax6 (F), or TUNEL (H). I–O: Double-labeling of E8 (I–L) or 10 retinas (M–O) infected with RCAS-ash1ΔCrb for viral protein p27 to identify infected regions (I, K, M, O) and for BrdU (J), ngn2 expression (L), AP2α (N), or TUNEL (O). Infected regions are marked by lines. Scale bars: 100 μm.
