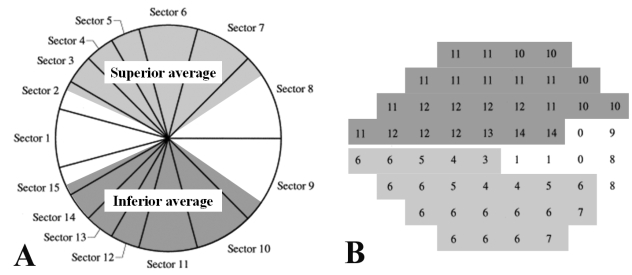
Fig. 1.
Correspondence map of the GDx-VCC regional parameters (A) and the HVFA 24-2 paradigm (B) for a right eye. In the present study, peripapillary GDx-VCC measurements and visual field test points were grouped into two regional corresponding sectors of superior and inferior average on the GDx-VCC printouts, based on the article by Garway-Heath et al.21 Corresponding sectors were grayscaled and named after the parameters on the GDx-VCC printouts (Superior and inferior average) in relation to the optic disc.

