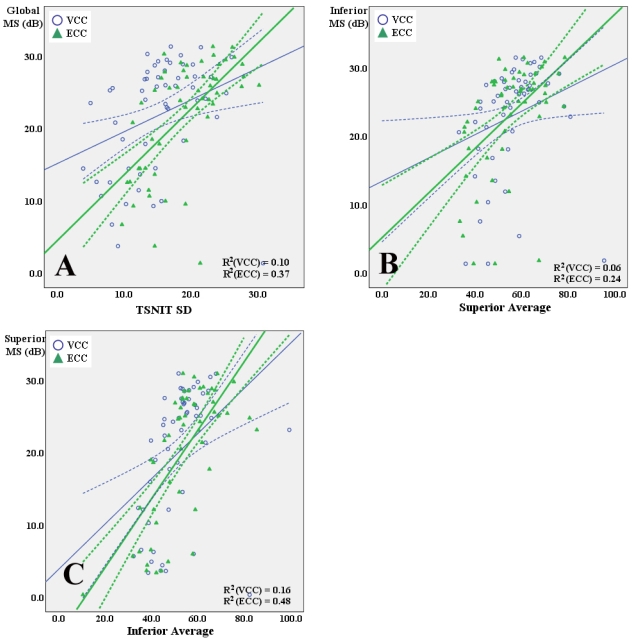
Fig. 2.
Scatterplots showing the associations between VCC and ECC parameters and corresponding retinal sensitivities expressed in dB by linear regression in eyes with ABP. (A) TSNIT SD with VCC and ECC versus global mean sensitivity (MS) expressed in dB. (B) Superior average with VCC and ECC versus inferior MS expressed in dB. (C) Inferior average with VCC and ECC versus superior MS expressed in dB. R2 values were significantly higher for linear associations of these SLP parameters with retinal sensitivity with ECC than with VCC (P-values: A, 0.001; B, 0.002; C, <0.001. Wilcoxon signed ranks test of the absolute prediction errors). Solid lines, linear fits; dashed lines, confidence intervals. R2 values are shown for each fit.

