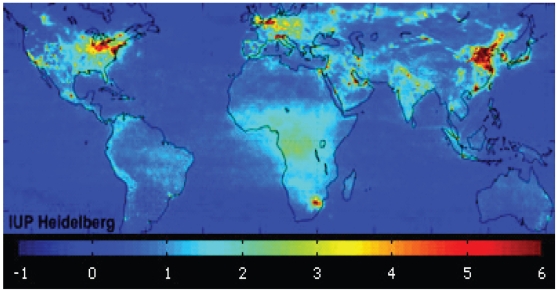
Figure 2.
Global mean tropospheric nitrogen dioxide (NO2) vertical column density between January 2003 and June 2004. Concentrations increase with color intensity: blue, lowest NO2 concentrations; deep red, highest NO2 concentrations. Eighteen-month average taken from www.esa.int/images/pollution_global_L.

