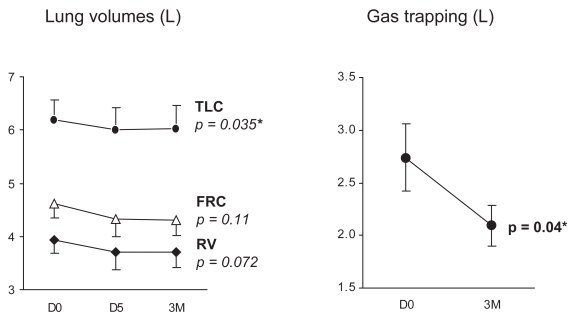
Figure 4.
Effect of NIV on lung volumes (left panel) and gas trapping measured as TLC – alveolar volume, (right panel). Mean (SEM) values at D0, D5, and 3M are shown. The fall in TLC and gas trapping were significant (p = 0.035 and 0.04, respectively).
Abbreviations: NIV, noninvasive ventilation; SEM, standard error of mean. TLC, total lung capacity.

