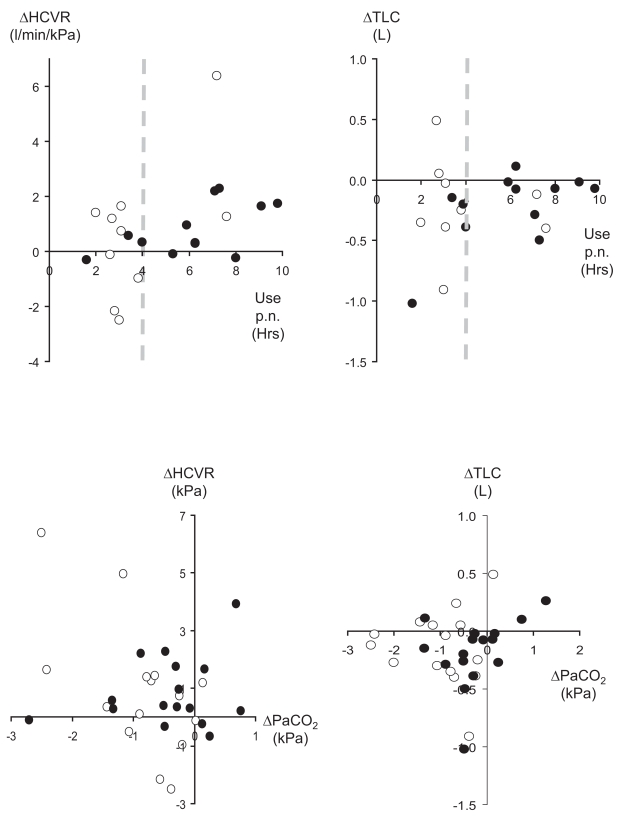
Figure 5.
Changes in the hypercapnic ventilatory response (left panels) and TLC (right panels) versus mean hours of NIV use per night (top panels) and change in PaCO2 (bottom panels). Closed circles denote data at D5 and open circles at 3M. Dotted lines in the top panels indicate 4 hours of use per night.
Abbreviations: HCVR, hypercapnic ventilatory response; NIV, noninvasive ventilation; PaCO2, arterial carbon-dioxide tension; TLC, total lung capacity.

