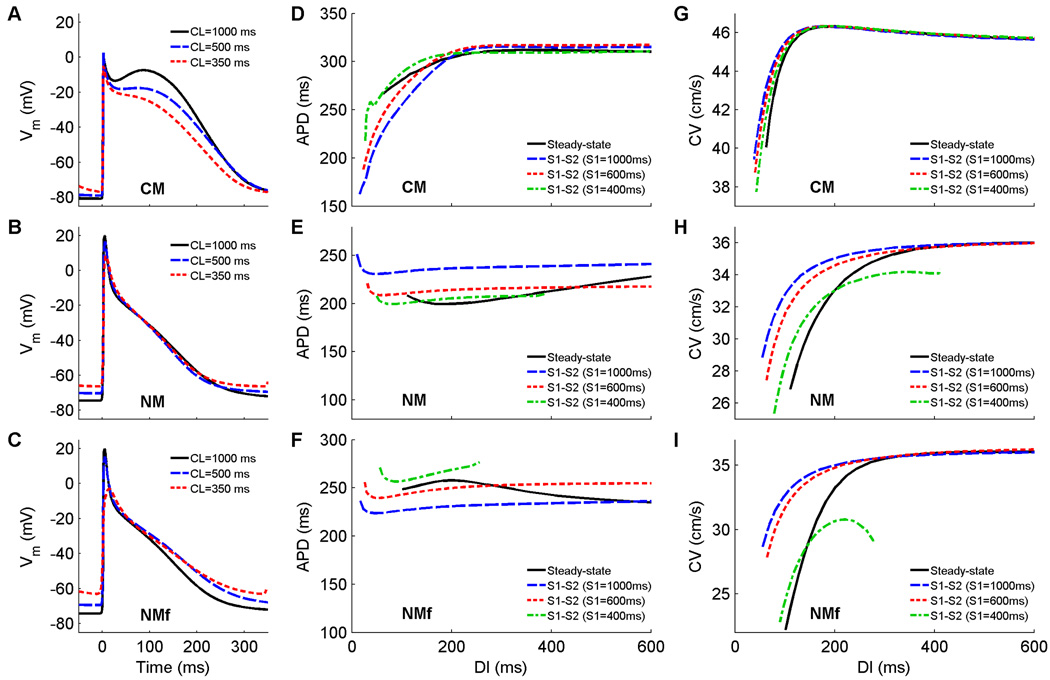
Figure 1.
A–C Action potentials at cycle lengths of 1000, 500, and 350 ms using the CM, the NM, and the NMf. Compared to isolated cell APs, the upstroke amplitude is decreased about 30 mV owing to electrotonic effects. All APs have been shifted in time slightly so that the upstrokes align at time=0 ms to allow better comparison. All traces are taken from node 80 along a one-dimensional cable with 100 nodes (Δx=0.025 cm). D–F Restitution of APD90 measured in a 1d cable for the CM, the NM, and the NMf. Steady-state restitution curves (solid lines) obtained after pacing for 30 seconds at each CL until 2:1 block was reached are shown along with S1–S2 restitution curves obtained after 30 seconds of pacing at three different S1 CLs over a range of premature S2s. Note that although the ranges of APDs vary among the curves, the scaling used is identical. Data points are taken from node 80 along a one-dimensional cable with 100 nodes (Δx=0.025 cm). G–I. Restitution of conduction velocity measured in a 1d cable for the CM, the NM, and the NMf. Both steady-state restitution curves (solid lines) and S1–S2 restitution curves are shown and indicate little CV memory for the CM but more substantial memory for the NM and NMf.

