Figure 3.
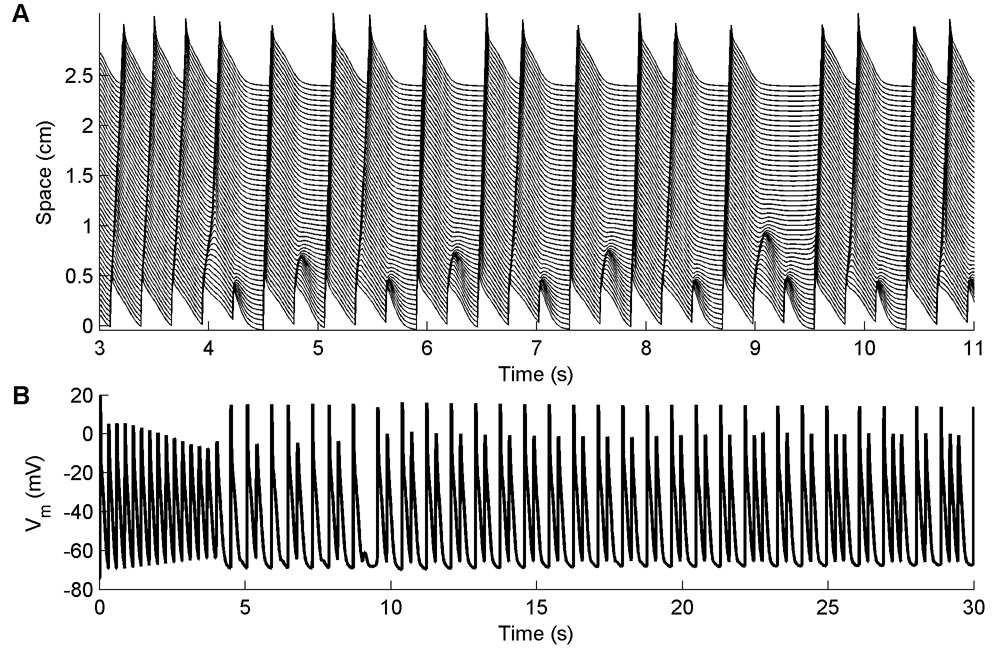
A. Block occurring along a one-dimensional cable using the NM. A. Space-time plot of propagating waves at a CL of 300 ms. Because there is little time for the tissue to recover after a previous beat, some waves propagate slowly, causing block away from the stimulus site on the subsequent beat. The precise location where 2:1 block occurs is variable, as is the number of successfully propagating beats between occurrences of block. No meaningful steady-state measurement of APD can be obtained after 30 seconds of pacing. This form of 2:1 block occurs for all variations of the Nygren et al. model in a 1d cable for short CLs, although the CL corresponding to the onset of oscillations varies between 280 and 440 ms (except for the NM-X and NMf-X, which have much shorter APs and consequently begin to show oscillations at a much shorter CL of 100 ms). B. Oscillations in membrane potential resulting from 2:1 block for the same case shown in A. Here the voltage is shown 1 cm away from the stimulus site.

