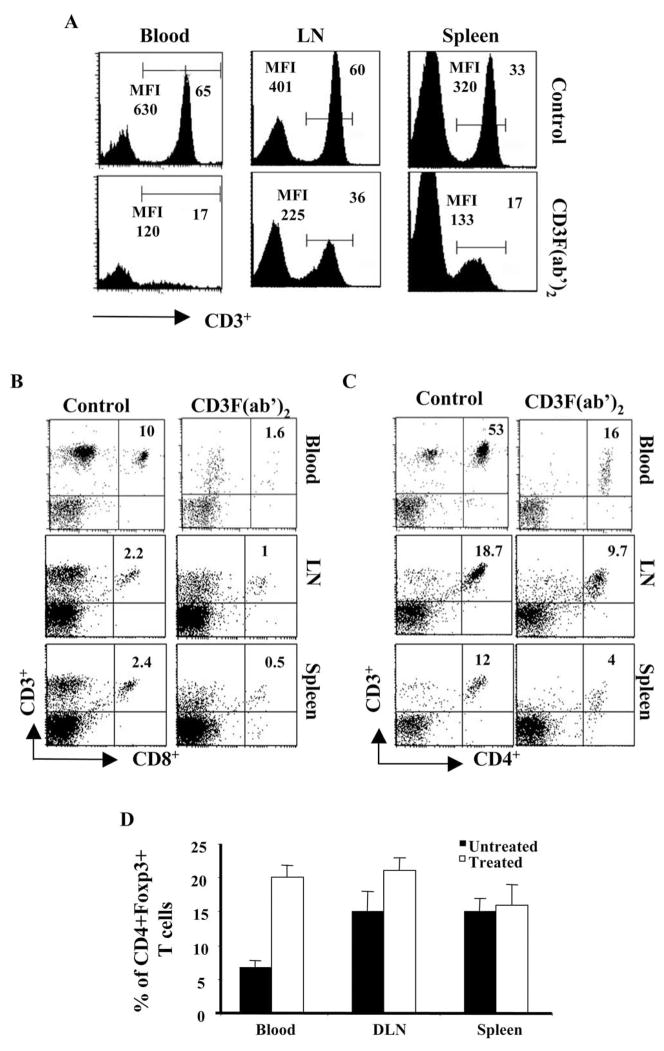
Figure 2.
Cells from the peripheral blood, spleen, and cervical lymph nodes of naïve Balb/c animals treated with CD3F(ab′)2 (24 hours posttreatment) were harvested. Surface staining with anti-CD3, anti-CD4, anti-CD8, and anti-CD25 surface markers was performed to determine the changes in the frequencies of lymphocytes post administration. Cells isolated from the respective tissues of untreated naïve Balb/c mice were used as a positive control. (A) The histograms show the intensity of CD3 expression in the blood, LNs, and spleens of untreated (upper panel) and CD3F(ab′)2-treated (lower panel) animals. (B, C) The dot plots show the CD8+CD3+ and CD4+CD3+ cells, respectively, in the blood, LNs, and spleens of untreated (left) and CD3F(ab′)2-treated (right) animals (gated on lymphocytes). The number on the upper right quadrant represents the percentage of cells when gated on lymphocytes. (D) The bar diagram shows the percentages of CD4+CD25+ T cells among the CD4+ T cells in blood, LNs, and spleens of untreated and treated Balb/c animals.

