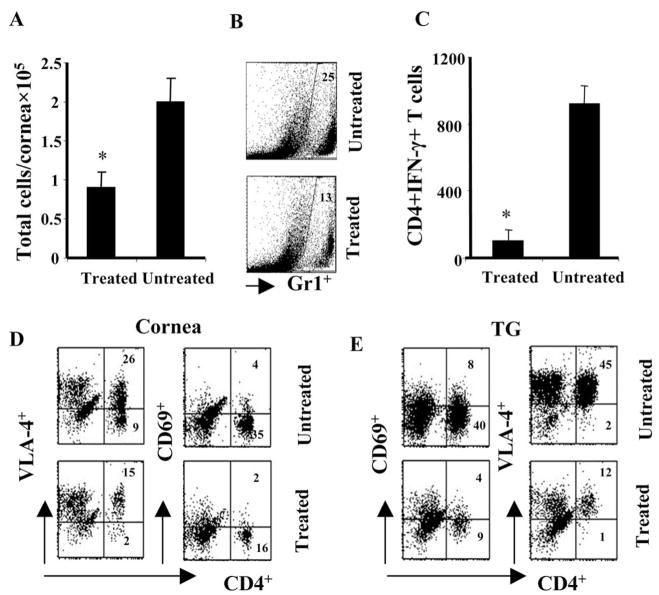
Figure 5.
Cellular changes in the corneas and TGs of CD3F(ab′)2- treated compared to untreated animals. Single-cell suspensions of the tissues (cornea, TG) from infected animals of both groups were analyzed at day 13 p.i. Flow cytometric analysis of surface markers were performed. (A) The bar diagram shows the absolute number of viable cells per cornea in both groups of animals at day 13 p.i. (B) The corneal cells were labeled for Gr1+ cells. The dot plots represent the Gr1+ cells in the untreated (upper plot) and treated (lower plot) corneas. (C) The bar diagram shows the absolute number of CD4+IFN-γ+ T cells present per cornea in both groups of mice. (D, E) The dot plots denote the CD4+VLA-4+ and CD4+CD69+ T cells in the cornea and TG of both groups. The number on the dot plots denotes the percentage of cells expressing VLA-4 or CD69 when gated on lymphocytes. *Statistically significant differences compared to untreated control (P ≤ 0.05).

