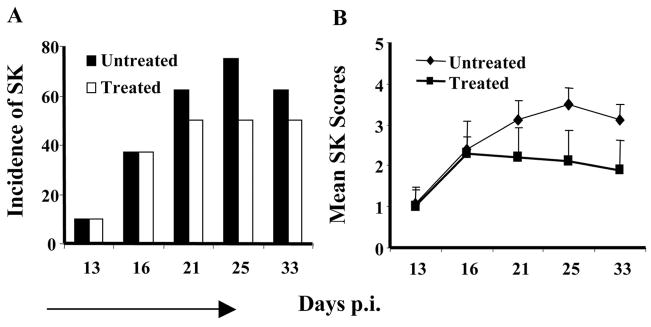
Figure 7.
Effect of CD3F(ab′)2 treatment on established SK lesions. (A) The bar diagram demonstrates the percentage severity of both groups of mice infected with 5 × 10⁵ pfu HSV-1RE at different time p.i. (B) The line diagram denotes the mean SK scores in treated and untreated animals at different time points p.i.

