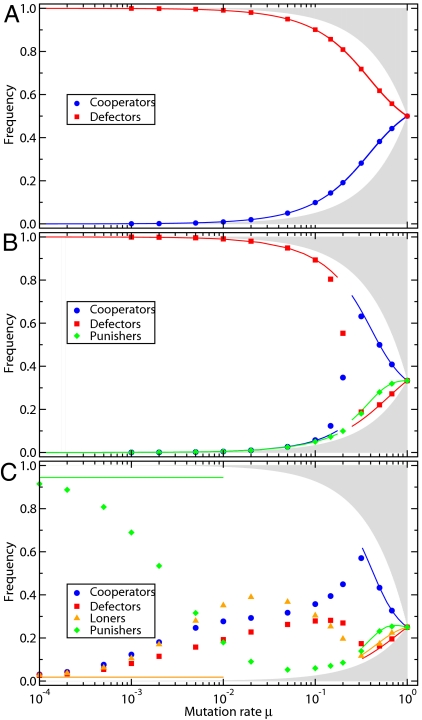
Fig. 2.
Imitation dynamics for different mutation rates. Symbols indicate results from individual-based simulations (averages over 109 imitation steps), and solid lines show the numerical solution of the Fokker–Planck-equation, corresponding to a vanishing drift term 𝒜k(x), see SI Appendix. Because a fraction μ of the population always mutates, the minimum fraction of each type is μ/d (for d strategies) and the gray shaded areas are inaccessible to the process. Although previous approaches have focused on small mutation rates, large mutation rates change the outcome significantly. (A) In compulsory public goods interactions, defectors dominate cooperators for all mutation rates. (B) In compulsory public goods interactions with punishment, defectors only dominate for small μ. For high mutation (or exploration) rates μ, cooperators dominate, see Fig. 1 for details. Despite their small abundance, punishers are pivotal for the large payoff and high abundance of cooperators for μ > 0.2. (C) In voluntary public goods games, cooperators dominate for high mutation rates as well. Although this effect does not depend on the presence of loners, these are essential for the success of punishers for small mutations. The horizontal lines for small μ, to which the symbols converge for μ → 0, is the stationary solution of the Markov chain, see SI Appendix (parameters: M = 100, N = 5, r = 3, c = 1; β = 1, γ = 0.3; σ = 1).

