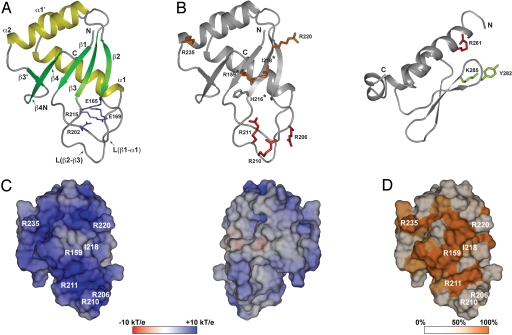
Fig. 5.
Crystal structure of the RRM domain of human L1 ORF1p. (A) Ribbons representation with α-helices in yellow and β-strands in green. The side chains forming the conserved salt-bridges are shown as sticks (blue). (B) Localization of mutated side-chains. The RRM (Left) and CTD (Right) domains are shown as ribbons with selected side chains as sticks (for colors see triangles in Fig. 2; asterisks: aromatic side chain in canonical RRMs; murine CTD (PDB-ID 2jrb (24)) shown with human amino acid numbers). (C) Electrostatic potential mapped on the molecular surface of the RRM domain (pI = 10.6). Potentials are contoured from −10 kT/e (red) to + 10 kT/e (blue). (Left) View as in A, onto the surface of the β-sheet and the adjacent loop L(β2-β3). (Right) Backside view, 180° from (A). (D) Surface colored by sequence conservation. Sequence similarity among placental mammals (Fig. 2, group I) is color-ramped : white (50% or less) to orange (100%). All three-dimensional representations are done with PyMOL (http://www.pymol.org).

