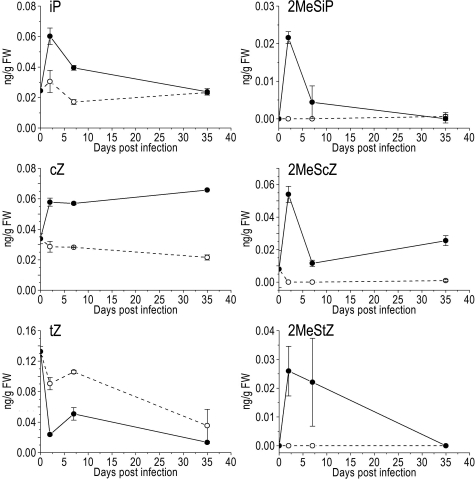
Fig. 4.
Cytokinin profiles in Arabidopsis Col-0 shoots at different time points during the interaction with R. fascians. The respective CK base is indicated above each graph; mock-inoculated with water (dashed line, open circle), upon infection with strain D188 (full line, filled circle). Error bars represent SDs (n = 3).

