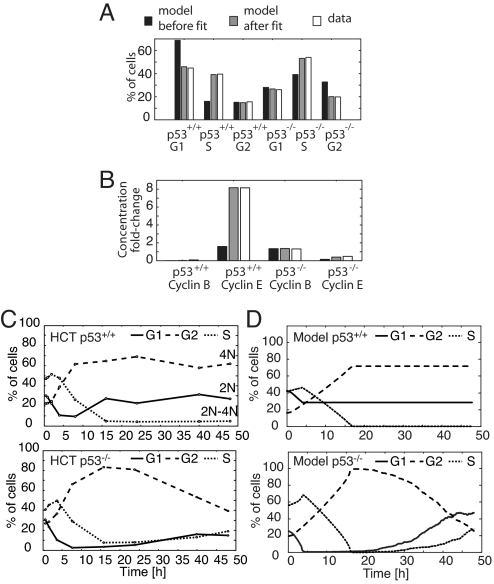
Fig. 4.
Cell cycle model training and prediction. (A) Fractions of G1, S, and G2 cells in freely cycling HCT p53+/+ and HCT p53−/− populations are compared with the amount of time spent by the initial and the fitted model in G1, S, and G2. (B) The ratios of cyclins E and B during IR-induced arrest to their maximum level during normal cycling in both HCT p53+/+ and p53−/− cells, compared with the ratios calculated from model trajectories. (C) Time courses of DNA content after treatment with 10 Gy IR. HCT p53+/+ and p53−/− cells were irradiated, and the fractions of cells with G1, S, and G2 DNA contents were measured by FACS. For apoptotic fraction, see Fig. S2F. (D) Model-generated cell cycle distribution time courses. Individual model trajectories (5 × 10²) were simulated from initial conditions distributed through the cell cycle (SI Appendix, “Simulating populations of cells”).

