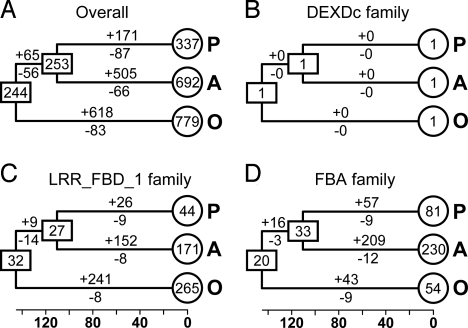
Fig. 3.
Evolutionary change of the number of F-box proteins in plants. The numbers in circles and rectangles represent the numbers of genes in extant and ancestral species, respectively. The numbers with plus and minus signs indicate the numbers of gene gains and losses, respectively, for each branch.

