Abstract
Objectives
To evaluate early predictors of advanced pharmacy practice experience (APPE) performance using either timed pharmaceutical care plan (TPCP) reports of 4 case histories or traditional lecture-based pharmacotherapy course examinations.
Methods
Statistical process control (SPC) methods were used to identify a group of third-year pharmacy students “at risk” for poor APPE performance (defined as an APPE grade point average of < 3.0). Examination scores from an integrated lecture-based pharmacotherapy sequence were used for comparison.
Results
TPCP scores but not lecture-based examination scores successfully identified 6 of 10 students who ultimately performed poorly in their APPEs.
Conclusion
Adaptation of SPC methods to assess student performance during problem-based learning (PBL) case reports is a useful technique for identifying students “at risk” for poor APPE performance.
Keywords: problem-solving, problem-based learning, assessment, advanced pharmacy practice experience, pharmaceutical care, performance
INTRODUCTION
The skills and abilities necessary for competent clinical practice include an extensive pharmacotherapy knowledge base, good critical thinking and problem-solving abilities, and strong communication skills. To this end, pharmacy education has been gradually transitioning from largely didactic, instructor-based teaching to more active, student-centered learning, including development of problem-based learning (PBL) curricula. Cisneros et al summarized the status of PBL within pharmacy and medical education, including a review of PBL research efforts by pharmacy educators.1 PBL activities within pharmacy schools and colleges improve GPA,2 examination scores,3 and student perceptions of enhanced critical thinking,4 problem-solving,5 self-learning skills,6 and preparation for advanced pharmacy practice experiences (APPE).7 Need for more research has been cited by numerous authors to include the development of valid and reliable measures to assess PBL outcomes as well as different methodologic approaches to provide multiple perspectives.1,3,6
This analysis retrospectively evaluated the use of 4 TPCP reports performed as part of a 2-semester PBL curricular sequence. The primary objective was to evaluate the use of statistical process control (SPC) methods to predict students “at risk” for poor performance during their subsequent APPE curriculum. Additionally, the utility of this PBL examination method was compared to a subset of traditional lecture-based pharmacotherapy course examinations for predicting APPE performance.
METHODS
The PBL curricular sequence, a 4 semester case-based problem-solving recitation (Introduction to Clinical Problem-solving, PHAR 905 and Case Studies in Pharmacy, PHAR 906, 907, and 908) met for 2 hours twice a week beginning in the spring semester of the first year (P1) through the third year (P3) fall semester. The first 2 semesters were taught by basic science faculty members and the last 2 by clinical faculty members. This study evaluated spring P2 and fall P3 students for the years 2003-2005 (ie, graduating classes of 2005-2007). The course requirements included a midterm and final examination each semester in which students were presented with a new patient case history (ie, chief complaint, history of present illness, past medical history, etc) and allowed 2 hours to research, identify, and document a TPCP. Online and/or textbook reference materials were freely accessible during the examination period. The examination cases were developed by clinical faculty members involved in the course, and an attempt was made to gauge the case to the appropriate student level (ie, P3 examinations are less focused and more complicated than P2 examinations). Medical diagnoses were provided, but all drug-related problems were the student's responsibility to correctly identify and resolve.
The case studies curriculum includes at least 2 practice cases prior to each examination that were facilitated by a clinical faculty member in small groups of 6-8 students. Practice cases were analyzed and solved as a group exercise in order to demonstrate the problem-solving process. A more detailed description of this process has been previously reported.8 Additionally, the case studies sequence provided other active-learning strategies including journal club and patient drug profile review exercises. Case study instructors were rotated every 8 weeks after completion of the midterm or semester final case examinations. This ensured that each student was evaluated by 4 different clinical faculty members during the 2 semesters. During the study period, the midterm and final examinations comprised 30% of the semester course grade. To assist in standardizing examination grading among the 8-10 faculty members involved, a scoring key was developed by 1 or more of the case study instructors. Additionally, a standardized student evaluation instrument was also used throughout the case studies sequence that is identical to that used for APPEs. This provided students with individual feedback regarding their patient care skills, problem-solving/critical-thinking skills, and professionalism and was used as part of each final APPE grade determination (available from the author).
The APPE curriculum comprised seven 6-week APPEs. These included advanced pharmacy experiences in institutional, community, ambulatory care, in-patient medicine, 2 pharmaceutical care specialty experiences, and 1 elective. A final letter grade was assigned upon completion of each APPE, and plus/minus grading was used at the discretion of the instructor. Community and institutional APPEs were taught by volunteer practitioners, while pharmacist-directed patient care experiences were taught by College faculty members. Since poor APPE performance did not appear to be associated with any specific type of experience, the final grades for all 7 practice experiences were averaged.
The pharmacotherapy sequence is an integrated organ-system approach to drug-therapy management and was taught in blocks of 3-5 weeks (8-10 lecture hours/week). Each module integrated pathophysiology, medicinal chemistry, pharmacology, and therapeutics and was begun in the P2 year with a summary capstone review course in the P3 year just prior to beginning APPEs. Additional information regarding the professional curriculum and course sequencing is available online.9
Student case study performance was computed from the mean score of the 4 midterm/final case study TPCPs taken during the P2 and P3 year. Similarly, a mean score for all 7 APPEs was calculated for each student based upon an assigned grade point value (ie, A = 4.0, A- = 3.75, B+ = 3.5). The graduating classes (ie, 2005-2007) and their corresponding case study performances were evaluated.
Pharmacotherapy course module scores were used for comparison with the TPCP scores as a predictor of APPE performance. The mean of 21 pharmacotherapy examinations representing the last 5 course modules (ie, P3 pharmacotherapy modules include Infectious Disease I and II, Endocrine Pharmacotherapy, Special Populations, CNS Pharmacotherapy, and Capstone Therapeutics) was computed for the 2007 graduating class.
An adaptation of statistical process control (SPC) methods was used to identify those students who performed significantly below that of their peer group. The fundamental statistical analysis used in all SPC methods is calculation of a mean (or occasionally median) performance measure along with upper and lower control limits representing 3 standard deviations (3σ) above and below this center line. When plotted over time, a control chart representing random variation associated with a particular process is produced. Originally developed for improving the quality and efficiency of manufacturing processes, SPC methods are increasingly finding applications related to quality improvement within health care delivery processes.10,11 For this investigation, performance was plotted by student rather than by time. Although calculation of the mean and standard deviation for educational evaluation is common, application of SPC software and methods affords a simple and possibly novel educational use.
A statistical software program (SPC XL, Six Sigma Products, Colorado Springs, CO) was used to construct an X-bar S control chart in which mean performance for each student was plotted against the calculated class mean, using upper and lower control limits (± 3σ). The corresponding S charts were consistent with the X-bar plot and, therefore, not duplicated. Thus, for purposes of this study, Figures 1-4 represent X-bar control charts adapted to characterize inter-student variation (ie, expected variation between students). While points falling outside the control limits normally represent special cause variation, it was used here to define an “at risk” student cohort. After some trial and error, this definition was later expanded to include student scores falling within or below the -3 sigma zone.
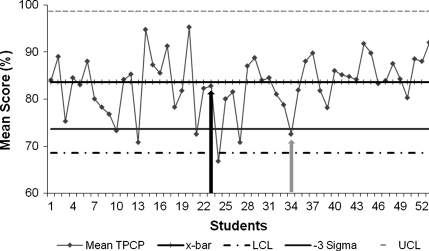
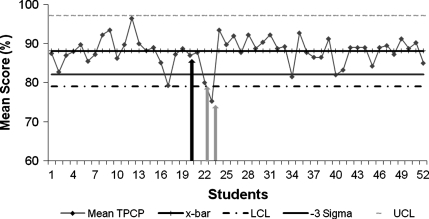
Figure 1.
Timed pharmaceutical care plan examination (TPCP) scores for the graduating class of 2005 (n = 54). Mean TPCP = mean of 4 examinations for each student. X-bar = overall class mean TPCP score. LCL = lower control limit. UCL = upper control limit. -3 sigma delineates third sigma zone below the class mean. Scores on or below this line defines students at risk for poor advanced pharmacy practice experience (APPE) performance. Arrows identify students who received < 3.0 cumulative grade point average during subsequent APPE year (dark = false negative; light = true positive).
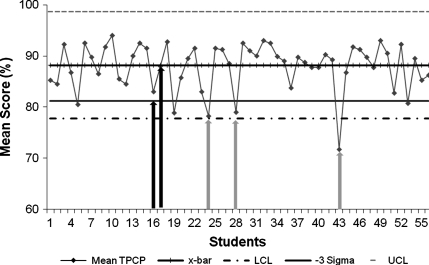
Figure 4.
Pharmacotherapy examination scores for graduating class of 2007 (n = 56). Mean score = average of 21 examinations for each student. X-bar = overall class mean score. LCL = lower control limit. UCL = upper control limit. -3 sigma delineates third sigma zone below the class mean. Scores on or below this line defines students at risk for poor advanced pharmacy practice experience (APPE) performance. Arrows identify students who received < 3.0 cumulative grade point average during subsequent APPE year (dark=false negative).
RESULTS
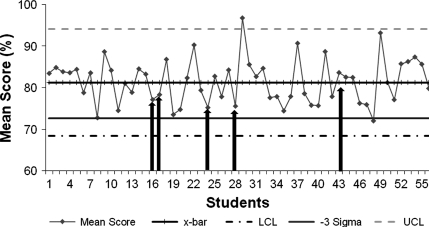
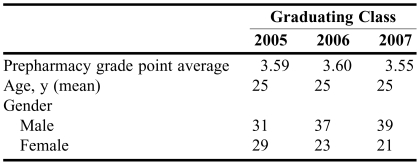
General demographic information describing the admission characteristics for the graduating classes of 2005-2007 are presented in Table 1. One hundred eighty students were matriculated into the entering classes, and 162 students ultimately graduated from the 3 classes. X-bar SPC charts for the graduating classes of 2005, 2006, and 2007 representing the mean of 4 case study examinations for each student, the overall class mean, and upper and lower control limits are presented in Figures 1-3. For ease of visual interpretation, only the -3σ zone is identified graphically, and a line chart was employed although no ordered data sequence is implied. Students falling on or below the -3σ line were defined as at risk for poor APPE performance. Students who subsequently completed the fourth year APPEs with < 3.0 cumulative experiential GPAs are identified by shaded arrows.
Table 1.
Demographic Information of Entering Classes
Figure 3.
Timed pharmaceutical care plan examination (TPCP) scores for the graduating class of 2007 (n = 54). Mean TPCP = mean of 4 examinations for each student. X-bar = overall class mean TPCP score. LCL = lower control limit. UCL = upper control limit. -3 sigma delineates third sigma zone below the class mean. Scores on or below this line defines students at risk for poor advanced pharmacy practice experience (APPE) performance. Arrows identify students who received < 3.0 cumulative grade point average during subsequent APPE year (dark = false negative; light = true positive).
After aggregating the 3 graduating classes, 10 students (6.2% of all graduating students) received a cumulative GPA of < 3.0 during their APPE curriculum and TPCP test scores correctly identified 6 of these students (ie, true positives). Table 2 reports aggregated test parameters including the number of true positives (TP=6), true negatives (TN=141), false positives (FP=11), and false negatives (FN=4). The test sensitivity (60.0%) and specificity (92.8%) were calculated using the following definitions: sensitivity = TP/TP+FN and specificity = TN/TN+FP. Table 2 also reports the calculated positive predictive value (TP/TP+FP = 0.353) and the negative predictive value (TN/TN+FN = 0.972).
Table 2.
Three-Year Summary Data on the Use of Pharmaceutical Care Plan Examinations to Identify Students at Risk of/for Poor Performance in Advanced Pharmacy Practice Experiences
Abbreviations: APPE = advanced pharmacy practice experience; GPA = grade point average
aDefined as mean case studies grade equal to or below the -3 σ zone
Figure 4 shows the X-bar SPC chart for pharmacotherapy test scores from the 2007 graduating class. Although 1 student's performance fell below the (-3σ) zone, none of the 5 APPE poor performers in 2007 were identified using the pharmacotherapy test scores.
DISCUSSION
One of the most difficult problems in pharmacy education is the issue of poor student performance during the advanced experiential year. While a number of variables may impact a student's success or failure in APPEs, an inability to effectively grasp the key elements of a clinical situation and arrive at a rational conclusion is particularly troubling. Poor problem-solving skills are not easily detected in didactic coursework, and even successful active-learning strategies may fail to identify these students, especially if they are group-based exercises. The ability to identify students at high risk for poor experiential performance early in the curriculum would provide obvious benefits, including the opportunity to develop remedial programs, and if these are unsuccessful in improving the student's performance/skills, appropriate career counseling activities.
Although no single measure will likely predict all student performance issues, the current investigation demonstrates the utility of a relatively simple activity for predicting success during the experiential year. The negative predictive value (NPV) of 0.972 suggests the methodology is quite useful and will successfully predict 97.2% of those students who will perform successfully during APPEs. Although the positive predictive value (PPV) of 0.353 is less helpful, accurately identifying only a third of those students testing positive as true positives, the low prevalence of poor performers still affords a useful method for focusing additional educational resources. Certainly, it is far better than use of didactic grades for this purpose. Additional measures (eg, communication and/or counseling skills, professionalism, etc) are potential areas for future research, and introductory pharmacy practice experiences (IPPEs) provide new assessment opportunities that may enhance development of a more robust model.
Generalizing these results to other colleges and schools of pharmacy is difficult, and the utility of these results in our program probably is derived from several important aspects of our curriculum. The Idaho State University pharmacy curriculum is extensively integrated into an organ system approach. Basic sciences including pharmacology, medicinal chemistry, and selected pharmaceutics/ pharmacokinetics applications are integrated into the pathophysiology and therapeutics for each disease state. This begins in the third semester (ie, fall of the P2 year) and affords the opportunity to use relatively complex case-based assessment activities for at least a few disease states early in their professional development. In our previous more traditional curriculum in which courses were largely taught by discipline (ie, pharmacology, medicinal chemistry, pharmaceutics), therapeutics did not occur until the P3 year, thus hindering use of advanced case-based assessment until late in the students' didactic preparation. Additionally, our curriculum has utilized an active learning, problem-solving case studies sequence for over 10 years. During this time, numerous changes and experiments have evolved the case studies course sequence into an effective learning method that is highly valued by students and faculty members. Certainly, this has provided clinical faculty members with an extensive experience base for delivering active-learning activities and grading course assignments, including the midterm and final examinations.
A number of other factors may also explain the utility of TPCP in predicting APPE performance. The course evaluation instrument used for case studies is identical to that employed during the APPE curriculum, and the instructors grading case studies are generally the same clinical faculty evaluating student performance during both the TPCP examinations and APPEs. Also, case study instructors are intentionally changed every 8 weeks so that students are exposed to a variety of clinical faculty members and their differing clinical approaches. This allows 4 different clinical faculty members to evaluate student performance on TPCP examinations. Thus, an evaluation process is created whereby identification of a student performance problem by multiple faculty members provides a highly persuasive argument for the existence of a true deficiency.
As evidenced from Figures 1-3, mean TPCP scores of “at risk” students may be quite high in comparison to typical undergraduate grading schemes. Therefore, grading criteria for the PBL case studies curriculum must either become stricter or a pedagogically different philosophy must evolve. After more than a decade of experience, a perspective has evolved within the case studies sequence, similar to that in graduate education, where “C” work is generally considered unacceptable, despite the lack of any formal progression requirements that reflect this criterion. Nevertheless, it is important to emphasize that PBL assessment for purposes of identifying “at risk” students is not determined by a percentage grade threshold, but rather through relative comparison with their peer group using straightforward SPC-based statistical methods as outlined above.
The lack of correlation between APPE performance and lecture-based pharmacotherapy scores was not surprising since similar comparisons had been attempted previously (unpublished personal observations). Furthermore, it underscores the reality that drug knowledge, while critically important, is only one aspect of successful APPE performance and presumably competent clinical practice. Problem-solving skills, in so far as they are actively taught and measured by our methods, are a significant contributor and may provide an important underpinning for developing a model with increased precision. Perhaps most importantly, the current findings provide additional evidence in support of PBL activities. Consistent with the challenge offered by previous PBL researchers, the study methodology utilizes an entirely different approach for evaluating the benefits of PBL. Certainly, the ability to predict future performance and identify remedial needs prior to APPEs is an extremely important educational outcome, and student assessment programs must evolve towards this end. Unquestionably, its role in our curriculum is secure and the remaining issues are related to its optimal design rather than its educational value.
Since Investigational Review Board approval was contingent on maintaining student anonymity throughout the data analysis process, the resource allocation associated with poor APPE performers could not be accurately assessed. Nonetheless, it is quite likely that several students identified as “at risk” were required to repeat 1 or more APPEs, resulting in delayed graduation and additional faculty resources. Given our current curricular structure, evaluation and identification of high-risk students occurs at the end of the P3 fall semester. This allows 1 semester for development of remedial efforts of “at risk” students prior to the APPE year, and these activities are continuing to evolve. Ideally, assessment and prediction of APPE performance problems would begin in the P1 year and could evolve from appropriately developed basic science-oriented case studies. Fortunately, examples of these activities have already been reported in the literature and these articles may serve as resources.5,6,12,13
Finally, additional standardization of both TPCP and APPE evaluations is certainly possible. Although both evaluations currently utilize some standardized grading criteria and rubrics, modest improvements in inter-rater reliability has the potential to improve predictive accuracy.
CONCLUSION
A timed pharmaceutical care plan write-up was useful in identifying students at risk for poor APPE performance. Inclusion of additional variables and/or better standardization of instructors' scoring for both TPCP and APPE evaluations may provide improved accuracy.
Figure 2.
Timed pharmaceutical care plan examination (TPCP) scores for the graduating class of 2006 (n = 54). Mean TPCP = mean of 4 examinations for each student. X-bar = overall class mean TPCP score. LCL = lower control limit. UCL = upper control limit. -3 sigma delineates third sigma zone below the class mean. Scores on or below this line defines students at risk for poor advanced pharmacy practice experience (APPE) performance. Arrows identify students who received < 3.0 cumulative grade point average during subsequent APPE year (dark = false negative; light = true positive).
ACKNOWLEDGEMENTS
The author would like to thank Drs. Paul Cady and Christopher Owens for their invaluable feedback and editorial assistance.
REFERENCES
- 1.Cisneros RM, Salisbury-Glennon JD, Anderson-Harper HM. Status of problem-based learning research in pharmacy education: a call for future research. Am J Pharm Educ. 2002;66:19–26. [Google Scholar]
- 2.Nii LJ, Chin A. Comparative trial of problem-based learning versus didactic lectures on clerkship performance. Am J Pharm Educ. 1996;60:162–4. [Google Scholar]
- 3.Raisch DW, Holdsworth MT, Mann PL, Kabat H. Incorporating problem-based, student-centered learning into pharmacy externship rotations. Am J Pharm Educ. 1995;59:265–72. [Google Scholar]
- 4.Haworth I, Eriksen SP, Chmait SH, et al. A problem-based learning case study approach to pharmaceutics: Facutly and student perspectives. Am J Pharm Educ. 1998;62:398–405. [Google Scholar]
- 5.Abate M, Meyer-Stout P, Stamatakis M, Gannett P, Dunsworth T, Nardii AH. Development and evaluation of computerized problem-based learning cases emphasizing basic science concepts. Am J Pharm Educ. 2000;64:74–82. [Google Scholar]
- 6.Herrier RN, Jackson TR, Consroe PF. The use of student-centered, problem-based clinical case discussions to enhance learning in pharmacology and medicinal chemistry. Am J Pharm Educ. 1997;61:441–6. [Google Scholar]
- 7.Hogan S, Lundquist LM. The impact of problem-based leaning on student's perceptions of preparedness for advanced pharmacy practice experiences. Am J Pharm Educ. 2006;70 doi: 10.5688/aj700482. Article 82. [DOI] [PMC free article] [PubMed] [Google Scholar]
- 8.Culbertson VL, Kale M, Jarvi EJ. Problem-based learning: a tutorial model incorporating pharmaceutical diagnosis. Am J Pharm Educ. 1997;61:18–26. [Google Scholar]
- 9.Idaho State University. http://www.isu.edu/academic-info/current/ISU_Ugrad_2007-2008.pdf#view=Fit
- 10.Kelly DL. How to Use Control Charts for Healthcare. Milwaukee, WI: Quality Press; 1999. [Google Scholar]
- 11.Carey RG. Improving Healthcare with Control Charts: Basic and Advanced SPC Methods and Case Studies. Milwaukee, WI: Quality Press; 2003. [Google Scholar]
- 12.Lubawy WC, Brandt BF. Microsituations as an active-learning tool to teach endocrine pharmacology and problem-solving skills. Am J Pharm Educ. 1998;62:333–4. [Google Scholar]
- 13.Roche VF, Marlene J, Aitken S, Zito W. Evaluation of computerized medicinal chemistry case study modules as tools to enhance student learning and clinical problem-solving. Am J Pharm Educ. 1999;63:289–95. [Google Scholar]


