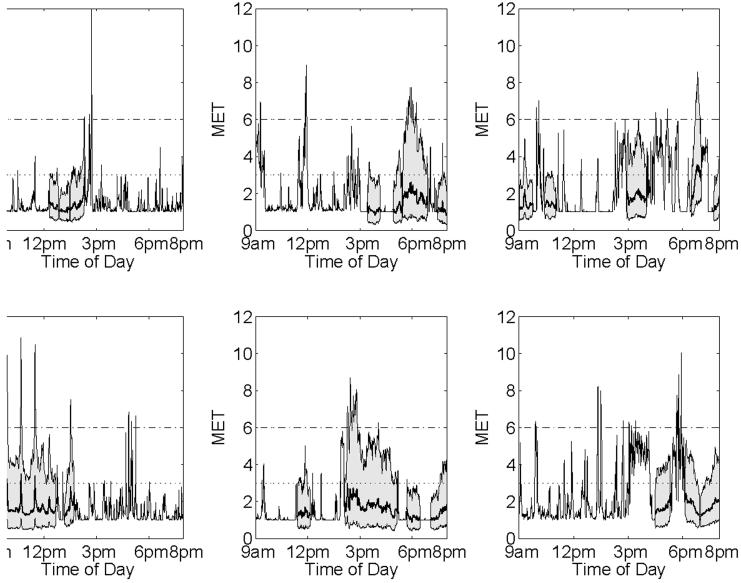
Figure 3. Imputation distributions.
Some incomplete profiles, with mean and 95% pointwise bounds from the joint imputation distribution substituted for the missing regions, as indicated by the shaded regions. These are based on the normal approximation to the posterior predictive distribution, estimated from posterior samples obtained from a Markov Chain Monte Carlo scheme applied to the complete case data.

