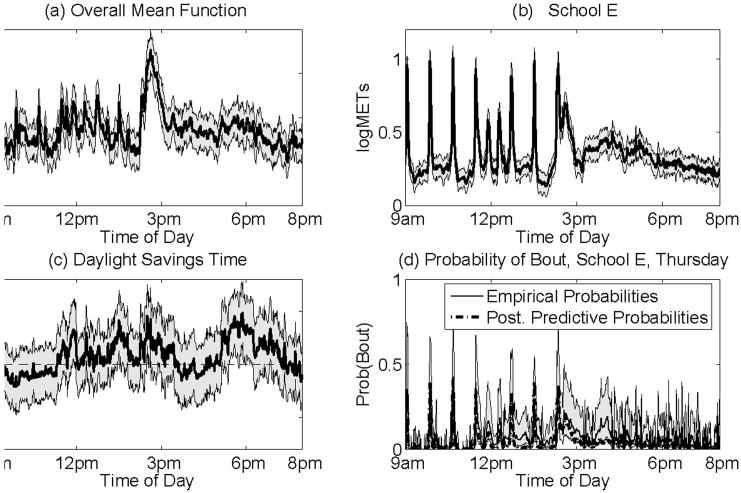
Figure 4. Results.
Posterior mean curves and 90% pointwise posterior credible intervals for the fixed effects curves for (a) overall mean curve, (b) school E, and (c) daylight savings time, plus (d) posterior predictive probabilities of bouts for a child from school E on Thursdays. The curve in (a) is obtained by averaging equally over the schools and conditioning on the mean value in the data set for all other covariates. The curve in (b) can be interpreted as the mean log profile on a Monday before daylight savings time for a child from school E with average BMI who is average with respect to the average number of hours of TV they watch per day. The curve in (c) is added to the mean log profile for any day after daylight savings time (April 6). The solid line in curve (d) indicates the wavelet-denoised empirical probabilities of bouts for each time point averaging over the 42 accelerometer profiles obtained on Thursdays from children enrolled at school E, along with 95% pointwise confidence bands computed using the method described in Bruce and Gao (1996). The dashed-dotted line indicates the posterior predictive probability of bouts from the functional mixed model for a child enrolled at school E on Thursday, for whom the levels of all other covariates are at their mean levels.

