
Fig. 1.
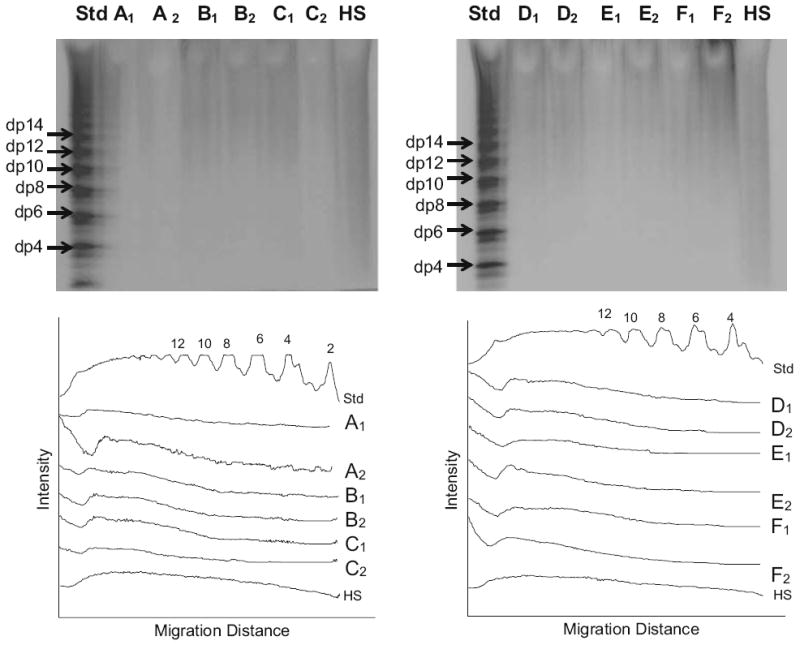
PAGE analysis on GAGs isolated from different tissues. Two gels are shown in the upper panels. Lanes (Std) are the heparin oligosaccharide standard. Lanes 1 to 12 are correspondence to GAGs from duplicate (i.e., A1, A2) samples (see Table 2). Lanes (HS) are heparan sulfate control. The lower panels show scanned data from each gel used to calculate the molecular weight of each GAG sample [23]